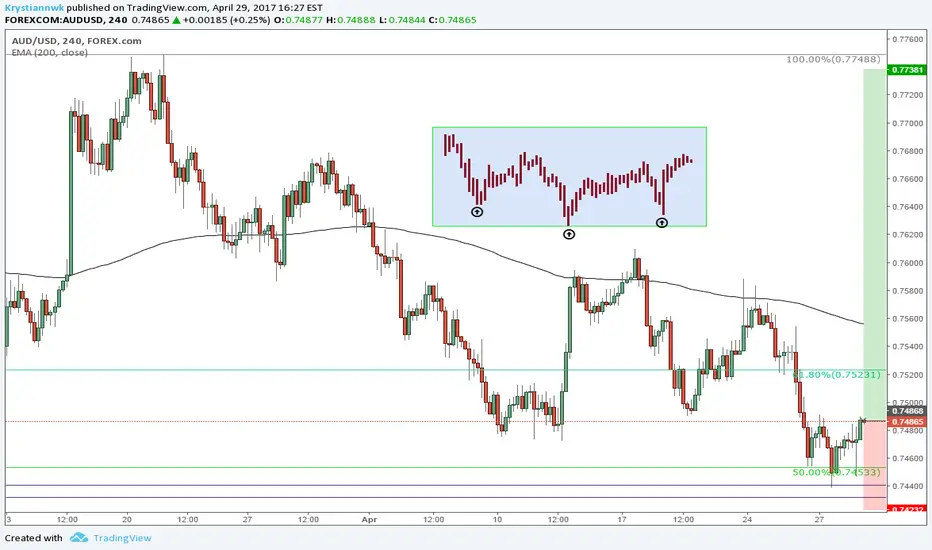
Fibonacci retracement 50% is a very good place to enter the market with low risk and high reward possibility(see link) . I found many interesting patterns on this chart.
Blue rectangle is showing head and shoulders formation on 1H chart.
Engulfing candle on 4H chart
There is Doji candle suggesting strong buying power at the 50% level
There is also GAP from Daily chart down below 50% marked with two blueish parallel lines.
All these patterns mentioned above are strong indicator that the pair will move towards TP area.
Publicaciones relacionadas
Exención de responsabilidad
La información y las publicaciones que ofrecemos, no implican ni constituyen un asesoramiento financiero, ni de inversión, trading o cualquier otro tipo de consejo o recomendación emitida o respaldada por TradingView. Puede obtener información adicional en las Condiciones de uso.
