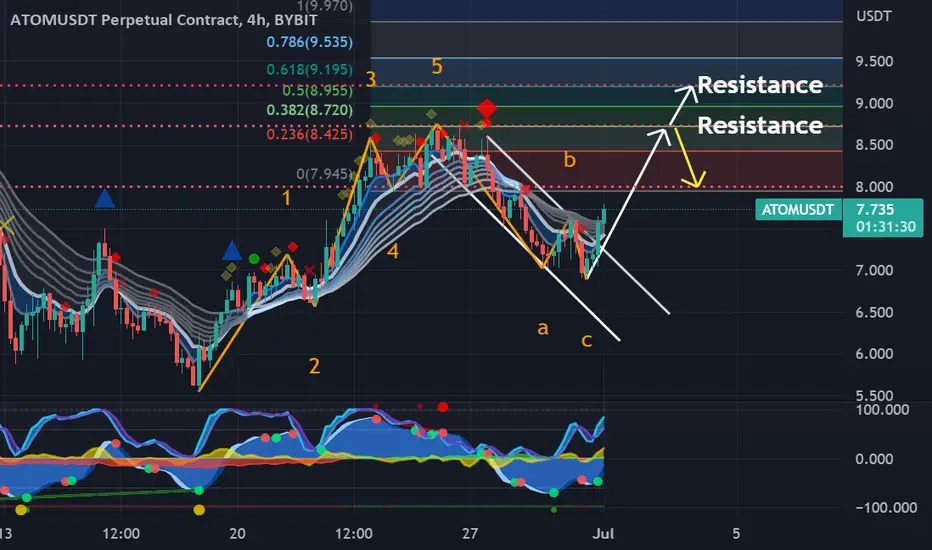
After completing Wave C with a double bottom, Atom bounced strong out of this falling channel. These are next two resistance zones that Atom has to break. If we break the first Fib resistance (.382), I expect it to shoot to the .618 fib extension. Momentum has just printed a green dot which is indicating an upward continuation of this breakout.
This chart based off of The Elliot Wave Theory, Fibonacci, EMA’s, MacD , RSI , Momentum, and resistance/support zones combined with patterns.
This chart based off of The Elliot Wave Theory, Fibonacci, EMA’s, MacD , RSI , Momentum, and resistance/support zones combined with patterns.
Exención de responsabilidad
La información y las publicaciones que ofrecemos, no implican ni constituyen un asesoramiento financiero, ni de inversión, trading o cualquier otro tipo de consejo o recomendación emitida o respaldada por TradingView. Puede obtener información adicional en las Condiciones de uso.