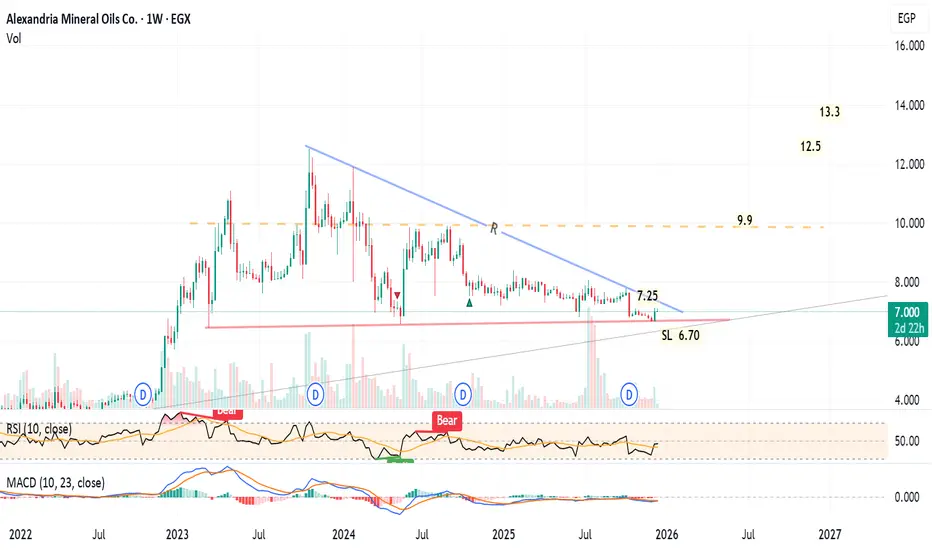
Weekly chart,
I can see a descending triangle pattern. The technical indicators: RSI is neutral, MACD is under 0 line. So, new entry should be after closing above 7.25 with high volume for 2 weeks.
The medium and long term targets will be 9.9 then 13.3 passing through some resistance levels including 11.9 and 12.5
Stop loss is 6.70, and raise the profit protection level as the price goes up.
Exención de responsabilidad
La información y las publicaciones no constituyen, ni deben considerarse como asesoramiento o recomendaciones financieras, de inversión, de trading o de otro tipo proporcionadas o respaldadas por TradingView. Más información en Condiciones de uso.
Exención de responsabilidad
La información y las publicaciones no constituyen, ni deben considerarse como asesoramiento o recomendaciones financieras, de inversión, de trading o de otro tipo proporcionadas o respaldadas por TradingView. Más información en Condiciones de uso.