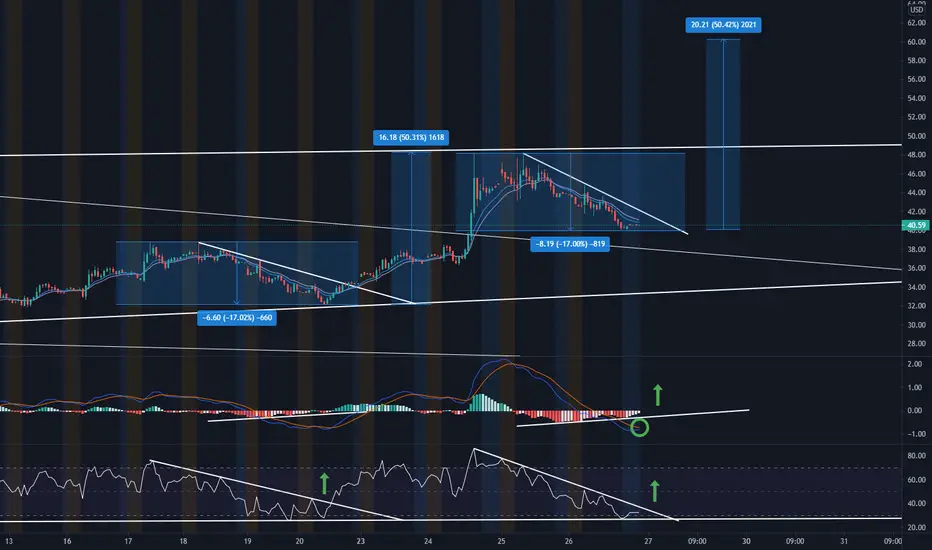
30 Minute Chart
As you can see, previously we dipped down 17% from $39 to $32.
Then we went from $32 all the way to our current highs of $48 around a 50% gain.
We have now seen a drop of around 17% from $48 to $40.
MACD is also showing signs of crossover to upside.
RSI showing a similar trend which we have hit the 30 level on RSI.
In both RSI patterns we have seen a bounce back to the overbought region (+70 RSI).
if we continue this pattern we could see another similar run up around 50% which would make for a 20 pt move from $40 to $60.
Please let me know what you guys think ! All comments welcome.
Leave a like if you enjoyed this setup.
Nota
$40 to $44 so far!Nota
$40.59 to $48! Looking ready to test $48 level!Join Smarter Traders 🧠 discord.gg/t8vkMapQ3m
Exención de responsabilidad
La información y las publicaciones que ofrecemos, no implican ni constituyen un asesoramiento financiero, ni de inversión, trading o cualquier otro tipo de consejo o recomendación emitida o respaldada por TradingView. Puede obtener información adicional en las Condiciones de uso.
Join Smarter Traders 🧠 discord.gg/t8vkMapQ3m
Exención de responsabilidad
La información y las publicaciones que ofrecemos, no implican ni constituyen un asesoramiento financiero, ni de inversión, trading o cualquier otro tipo de consejo o recomendación emitida o respaldada por TradingView. Puede obtener información adicional en las Condiciones de uso.