Astera Labs (NASDAQ: ALAB) is showing a clean higher-timeframe structure, consistently forming higher highs and higher lows, confirming a bullish long-term trend. However, the recent monthly candle shows potential for a short-term retracement, aligning with ICT principles for a re-entry opportunity.
Market Structure:
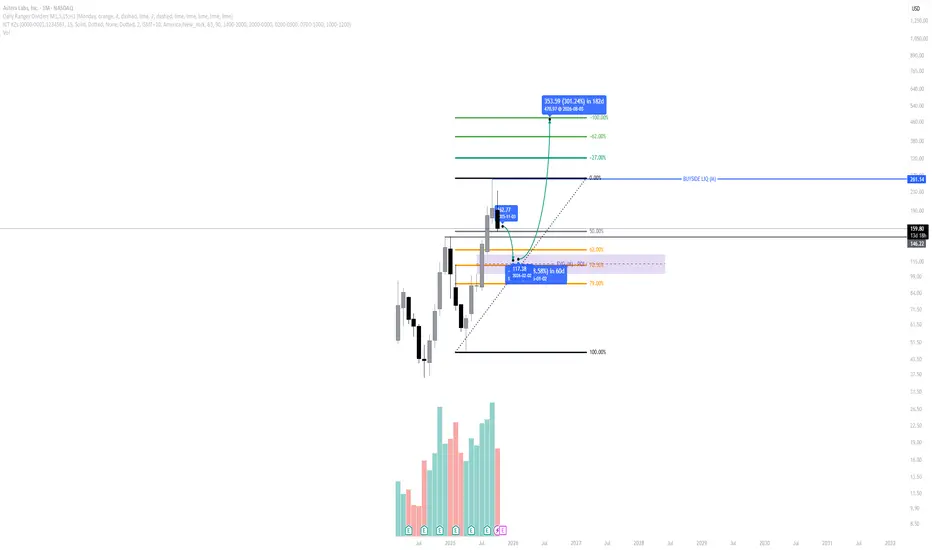
Price continues to respect its bullish framework, printing clear higher highs each impulse and leaving behind well-defined fair value gaps (FVGs) on the monthly chart.
The most recent swing suggests a possible retracement phase as the market seeks balance before another expansion leg.
Premium / Discount Context (OTE Zone):
Using the Fibonacci retracement from the last impulse, the Optimal Trade Entry (OTE) range sits between $122–$99, overlapping with the monthly FVG. This zone aligns perfectly with the 62–79% retracement region — the ideal “smart money” buy zone.
Liquidity Draw:
The buyside liquidity sits around $261, serving as the next major target. If the discount zone holds, the price could deliver a measured move toward $153 first, then a potential continuation toward $352 (long-term projection).
Volume Profile:
Increasing volume throughout prior impulses supports accumulation — indicating strong institutional participation on each retracement leg.
🎯 Outlook
Expect further downside into the FVG/OTE range ($122–$99) before a potential bullish reversal toward the $153–$261 liquidity levels.
If momentum confirms in this range, it could represent one of the best high-probability re-entry zones for 2025.
AS ALWAYS DYOR!
Market Structure:
Price continues to respect its bullish framework, printing clear higher highs each impulse and leaving behind well-defined fair value gaps (FVGs) on the monthly chart.
The most recent swing suggests a possible retracement phase as the market seeks balance before another expansion leg.
Premium / Discount Context (OTE Zone):
Using the Fibonacci retracement from the last impulse, the Optimal Trade Entry (OTE) range sits between $122–$99, overlapping with the monthly FVG. This zone aligns perfectly with the 62–79% retracement region — the ideal “smart money” buy zone.
Liquidity Draw:
The buyside liquidity sits around $261, serving as the next major target. If the discount zone holds, the price could deliver a measured move toward $153 first, then a potential continuation toward $352 (long-term projection).
Volume Profile:
Increasing volume throughout prior impulses supports accumulation — indicating strong institutional participation on each retracement leg.
🎯 Outlook
Expect further downside into the FVG/OTE range ($122–$99) before a potential bullish reversal toward the $153–$261 liquidity levels.
If momentum confirms in this range, it could represent one of the best high-probability re-entry zones for 2025.
AS ALWAYS DYOR!
Exención de responsabilidad
La información y las publicaciones no constituyen, ni deben considerarse como asesoramiento o recomendaciones financieras, de inversión, de trading o de otro tipo proporcionadas o respaldadas por TradingView. Más información en Condiciones de uso.
Exención de responsabilidad
La información y las publicaciones no constituyen, ni deben considerarse como asesoramiento o recomendaciones financieras, de inversión, de trading o de otro tipo proporcionadas o respaldadas por TradingView. Más información en Condiciones de uso.