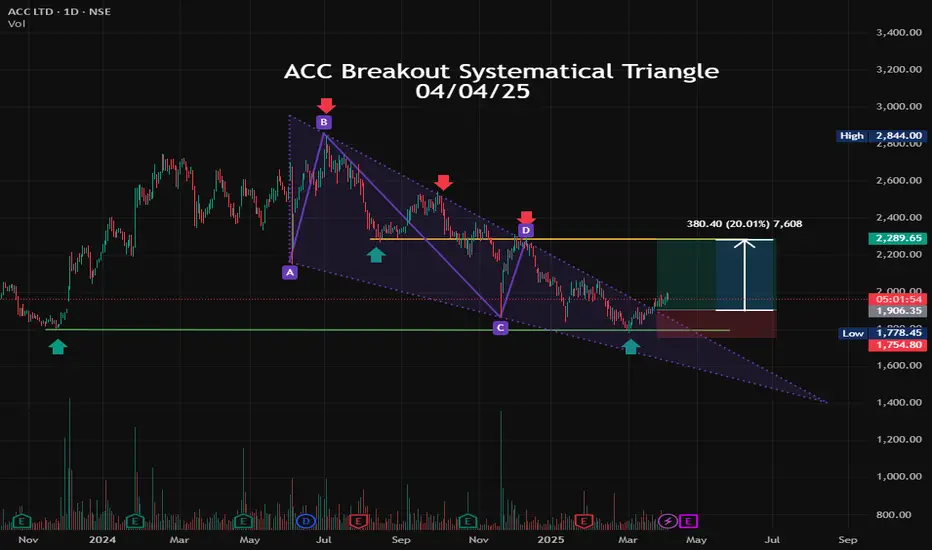
NSE INDIA, Symbol : ACC Timeframe : Daily. ACC systematical triangle start point A) 03/06/2024 first bottom B) Point b is life time high top 2855. C) Next lower low point D) Next higher high point I was drag this point to create systematical triangle. 25/3/2025 Acc breakout the triangle line and Acc last 1 week trade above the line. ACC return pull back in good support level. systematical triangle line breakout . It will be move up side 20% no any strong resistance then recommended target is 2290
mail Id : satyambeed@gmail.com
WhatsApp +919270007010
Telegram : @AI_Trend_My_Friend forms.gle/H5FUra2tFHn3WR8u6
WhatsApp +919270007010
Telegram : @AI_Trend_My_Friend forms.gle/H5FUra2tFHn3WR8u6
Exención de responsabilidad
La información y las publicaciones que ofrecemos, no implican ni constituyen un asesoramiento financiero, ni de inversión, trading o cualquier otro tipo de consejo o recomendación emitida o respaldada por TradingView. Puede obtener información adicional en las Condiciones de uso.