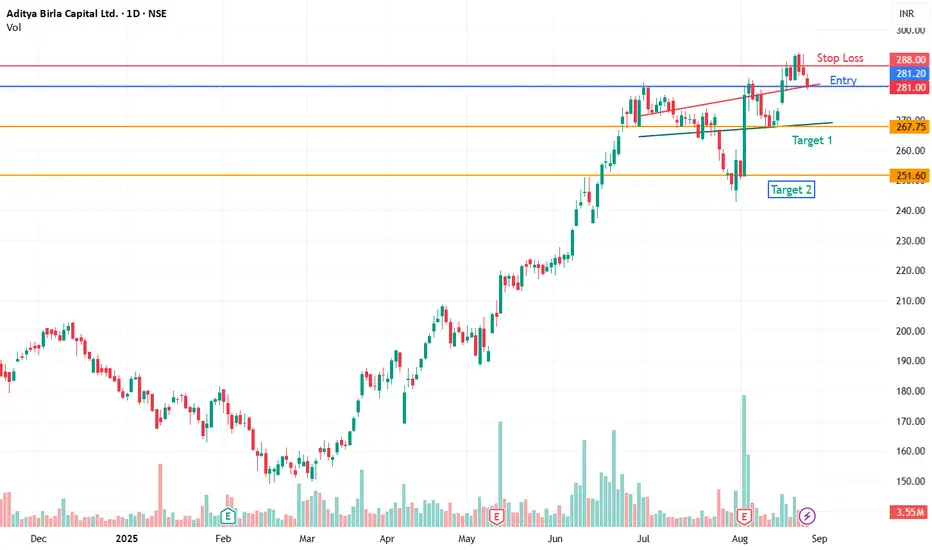
Current Price: ₹281.00
RSI (Relative Strength Index): 55.43 → Neutral to slightly bullish (above 50 but below 70).
✅ Support and Resistance
Supports:
S1: ₹268.00
S2: ₹271.35
S3: ₹271.60
Price is holding above key supports, which provides a cushion for buyers.
Resistances:
R1: ₹282.65
R2: ₹284.00
R3: ₹289.60
Stock is near immediate resistance (₹282–284 zone). Breakout above ₹289.60 could open higher levels.
✅ Fibonacci Levels
23.6%: ₹113.36
38.2%: ₹147.57
50.0%: ₹175.22
61.8%: ₹202.88
78.6%: ₹242.25
Current price (₹281) is well above the 78.6% retracement, indicating strong recovery and continuation of the uptrend.
✅ Moving Averages
Short-Term:
EMA5 = ₹283.68, SMA5 = ₹285.46 → Price slightly below → mild short-term weakness.
EMA9 = ₹281.96, SMA9 = ₹282.28 → Price hovering around → neutral.
Medium-Term:
EMA20 = ₹276.99, SMA20 = ₹273.83 → Price above → bullish medium-term bias.
Long-Term:
EMA50 = ₹265.27, SMA50 = ₹270.89 → Price above both → strength in broader trend.
EMA100 = ₹246.26, SMA100 = ₹240.71 → Price above → long-term bullish trend.
EMA200 = ₹226.74, SMA200 = ₹209.18 → Price well above → strong bullish structure.
Exención de responsabilidad
La información y las publicaciones no constituyen, ni deben considerarse como asesoramiento o recomendaciones financieras, de inversión, de trading o de otro tipo proporcionadas o respaldadas por TradingView. Más información en Condiciones de uso.
Exención de responsabilidad
La información y las publicaciones no constituyen, ni deben considerarse como asesoramiento o recomendaciones financieras, de inversión, de trading o de otro tipo proporcionadas o respaldadas por TradingView. Más información en Condiciones de uso.