【テクニカル概況】
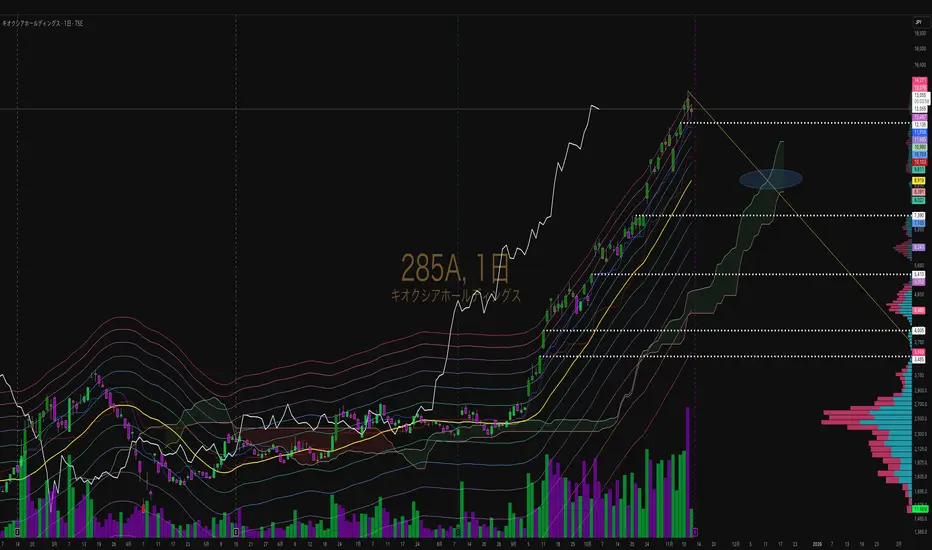
現在値は13,195円。
25日移動平均線は8,650円で、乖離率は+52.5%(強烈な加熱ゾーン)に位置。
エンベロープ上限を突破し、一目均衡表でも雲上を維持している。
出来高は52.43Mと直近で最大水準。
利確と調整売りが交錯しつつ、上昇波の終盤サインを示している。
⸻
【相場構造】
現在の上昇局面は、エリオット波動で見ると第⑤波の終盤にあたる。
決算を目前に控えた買いと利確の衝突局面であり、
短期的には「天井圏」での攻防フェーズに入っていると考えられる。
⸻
【未調整価格帯(下落ターゲット)】
上昇過程で形成された未調整価格帯は、今後の下落ターゲットとして注視したい。
主な価格帯は以下の通り:
• 12,135円:短期的な調整候補
• 7,390円:強めのサポート帯
• 5,410円:中期的な節目
• 4,005円:主要サポートライン
• 3,485円:深押し局面でのターゲット帯
これらの水準は、相場の反転・調整局面で意識されやすい価格帯となる。
⸻
【トレンドフェーズと今後の展開】
現在は「加熱ゾーン→調整フェーズ移行」の初期段階。
もし高出来高の陰線が出現すれば、短期天井の確度がさらに高まる。
まずは25日移動平均線(8,600〜9,000円前後)までの下落を想定し、
その水準での反発が確認できるかどうかが次の上昇フェーズへの分岐点となる。
もし25MAを明確に割り込む場合、
中期的には7,000〜5,000円台前半までの押しを視野に入れるべき。
⸻
【総合コメント】
現在値13,195円は過熱圏のど真ん中。
決算を目前に控え、利確と新規売りが交錯する典型的な過渡期。
出来高ピーク+乖離拡大=調整警戒シグナル。
まずは25MA(9,000円前後)での攻防を注視。
出来高減少と陰線転換を確認してから、短期の売り判断を検討するのが無難。
中長期では押し目形成後の再浮上も視野に入るが、
当面は「調整局面入り」として構えるのが現実的。
【ファンダメンタルズ補足】
直近決算では、黒字転換と同時に営業利益率が改善傾向を示しており、
AIサーバー・データセンター需要の拡大に伴うNANDフラッシュ価格の上昇が追い風。
ただし、依然として在庫調整圧力と市況依存の変動リスクは大きく、
根本的な業績トレンドはまだ安定とは言いがたい。
そのため、**ファンダ的にも「好材料出尽くし → 一時調整」**の構図が濃厚。
⸻
🇺🇸 Kioxia Holdings (285A) – Daily Chart Analysis
📅 Earnings Announcement: November 13, 2025 (Thu)
⸻
Technical Overview
Current price: ¥13,195
25-day moving average (MA25): ¥8,650
→ Deviation rate: +52.5% (overheated zone)
The stock has broken above both the envelope upper band and the Ichimoku cloud,
remaining in a strongly extended position.
Trading volume reached 52.43M, the highest level in recent sessions,
signaling potential exhaustion of buying momentum near the top.
⸻
Market Structure
The current advance appears to represent Wave (⑤) of the Elliott sequence — the late stage of an extended rally.
With earnings approaching, the market is in a transition zone between buying and profit-taking,
suggesting that short-term topping activity is underway.
⸻
Unadjusted Price Zones (Downside Targets)
During the recent uptrend, several unadjusted price zones have formed,
which may serve as downside targets once a correction begins.
• Around ¥12,135 – short-term adjustment zone
• Near ¥7,390 – stronger support region
• Around ¥5,410 – mid-term threshold
• Near ¥4,005 – key support level
• Around ¥3,485 – deep correction target
These levels are expected to act as reference points during a broader correction phase.
⸻
Trend Phase and Outlook
The stock is currently shifting from an overheated phase into a correction phase.
If a high-volume bearish candle forms, it would likely confirm a short-term top.
A first retracement toward ¥8,600–¥9,000 (MA25) is plausible,
and the reaction at that zone will define whether a new up-leg can begin.
If MA25 fails to hold, a mid-term decline toward ¥7,000–¥5,000 cannot be ruled out.
⸻
Summary
At ¥13,195, Kioxia remains in a heavily overheated state.
With earnings near, profit-taking and new short entries are overlapping — a classic transition phase.
Volume peak and expanding deviation indicate that a cooling phase is imminent.
Watching the ¥9,000 zone (MA25) will be crucial for short-term strategy.
Wait for a confirmed bearish reversal before acting.
Long-term investors may see opportunities after consolidation,
but for now, the chart points to an ongoing correction phase.
Fundamental Notes
Recent results showed a recovery in profitability and a turnaround to positive operating margins,
supported by improving NAND flash pricing amid AI and data-center demand.
However, inventory pressure and cyclical volatility remain significant,
suggesting that the recent rally may reflect “good-news pricing” rather than a sustained earnings trend.
#キオクシア #285A #日足分析 #株式投資 #テクニカル分析
#エンベロープ #一目均衡表 #フィボナッチ #出来高分析 #相場分析
#半導体株 #メモリ関連 #AI銘柄 #決算分析 #過熱圏
#短期トレード #中期投資 #チャート分析 #日本株 #投資家交流
#Kioxia #285A #Nikkei #JapanStocks #TechnicalAnalysis
#Ichimoku #Fibonacci #Envelope #VolumeAnalysis #ChartStudy
#Semiconductor #MemoryChips #AIStocks #EarningsAnalysis
#Overbought #CorrectionPhase #TradingView #JapaneseMarket #StockMarket
Exención de responsabilidad
La información y las publicaciones no constituyen, ni deben considerarse como asesoramiento o recomendaciones financieras, de inversión, de trading o de otro tipo proporcionadas o respaldadas por TradingView. Más información en Condiciones de uso.
Exención de responsabilidad
La información y las publicaciones no constituyen, ni deben considerarse como asesoramiento o recomendaciones financieras, de inversión, de trading o de otro tipo proporcionadas o respaldadas por TradingView. Más información en Condiciones de uso.