Pure CocaPure Coca - Trend & Mean Reversion Indicator
Overview
The Pure Coca indicator is a trend and mean reversion analysis tool designed for identifying dynamic shifts in market behavior. By leveraging Z-score calculations, this indicator captures both trend-following and mean-reverting periods, making it useful for a wide range of trading strategies.
What It Does
📉 Detects Overbought & Oversold Conditions using a Z-score framework.
🎯 Identifies Trend vs. Mean Reversion Phases by analyzing the deviation of price from its historical average.
📊 Customizable Moving Averages (EMA, SMA, VWMA, etc.) for smoothing Z-score calculations.
🔄 Adaptable to Any Timeframe – Default settings are optimized for 2D charts but can be adjusted to suit different market conditions.
How It Works
Computes a Z-score of price movements, normalized over a lookback period.
Plots upper and lower boundaries to visualize extreme price movements.
Dynamic Midlines adjust entry and exit conditions based on market shifts.
Background & Bar Coloring help traders quickly identify trading opportunities.
Key Features & Inputs
✔ Lookback Period: Adjustable period for calculating Z-score.
✔ Custom MA Smoothing: Choose from EMA, SMA, WMA, VWAP, and more.
✔ Z-Score Thresholds: Set upper and lower bounds to define overbought/oversold conditions.
✔ Trend vs. Mean Reversion Mode: Enables traders to spot momentum shifts in real-time.
✔ Bar Coloring & Background Highlights: Enhances visual clarity for decision-making.
How to Use It
Trend Trading: Enter when the Z-score crosses key levels (upper/lower boundary).
Mean Reversion: Look for reversals when price returns to the midline.
Custom Optimization: Adjust lookback periods and MA types based on market conditions.
Why It's Unique
✅ Combines Trend & Mean Reversion Analysis in one indicator.
✅ Flexible Z-score settings & MA choices for enhanced adaptability.
✅ Clear visual representation of market extremes.
Final Notes
This indicator is best suited for discretionary traders, quantitative analysts, and systematic traders looking for data-driven market insights. As with any trading tool, use in conjunction with other analysis methods for optimal results.
Análisis de tendencia

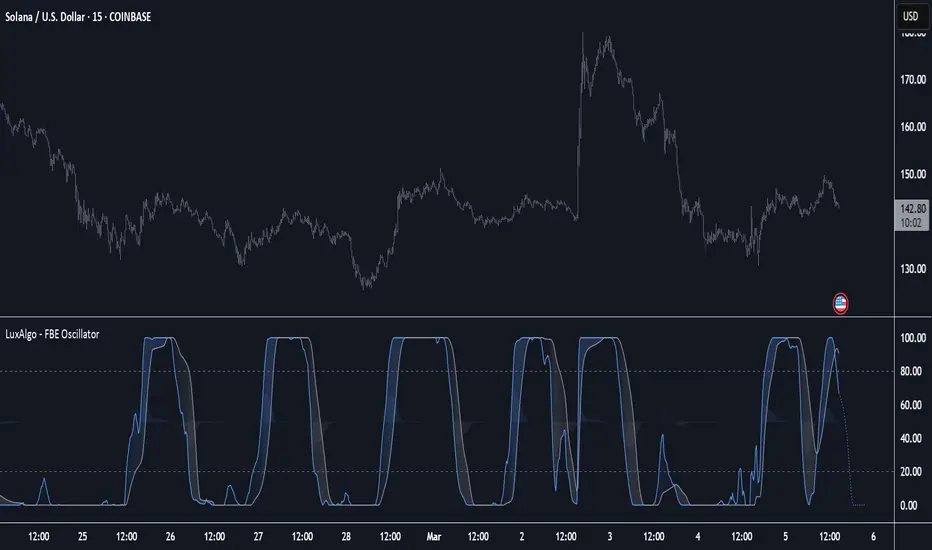
Forward-Backward Exponential Oscillator [LuxAlgo]The Forward-Backward Exponential Oscillator is a normalized oscillator able to estimate directional shifts by making use of a unique "Forward-Backward Filtering" calculation method for Exponential Moving Averages (EMAs).
This unique method provides a smooth normalized representation of the price with reduced lag.
🔶 USAGE
The oscillator consists of 2 series of values derived from normalizing the sum of each EMA's change across the selected user lookback window (length), one less reactive computed forward (in grey), and the other re-calculated backward for each bar (in blue).
Given this "Forward-Backwards" calculation method, we are able to produce a more reactive oscillator compared to the same operation done on a simple double-smoothed EMA.
The interaction between these 2 values (Forward Value and Backward Value) can highlight shifts in market momentum over time.
When the Forward Value is above the Backward Value, the price is seen moving up, and likewise, when the Forward EMA is below, the Backward EMA price is seen moving down.
The indicator specifically displays the difference between values through a histogram located at the 50 mark on the oscillator.
🔹 Projection
We project the approximated future values of the forward value in front of the current line. This helps show the data that is being used for the creation of the Forward Value.
🔹 Length & Smoothing
The Smoothing Input controls the length of the EMAs which are analyzed.
The Length Input controls the lookback for the sum of changes from the EMAs.
Displayed below is a comparison of varying input sizes and their results.
As seen above:
A larger length input will result in slower, gradual movement by the oscillator since the summed values are from a larger lookback.
A higher smoothing setting will result in smoother EMAs, leading to a smoother oscillator output that is less contaminated by noisy variations.
Note: The length of the projection is tied to the "length" input, to get a longer projection, a larger length is required.
🔶 DETAILS
Forward-backward filtering is a method applied to LTI (linear time-invariant) filters to provide a filter response with zero-phase shift, this has the visible effect of shifting a regular causal filter response to the right, making it appear has have effectively 0 lag.
The name of this operation indicates that the filter is first calculated forward over a series of values (like regular moving averages), then calculated backward, using the previous output as input for the filter, effectively applying the filter twice.
While this operation effectively allows us to obtain a zero-lag response when applied to an EMA, it is subject to repainting, as this indicator only returns the normalized sum of changes of the forward-backward EMA, which does not introduce any repainting behaviors in the final output of the oscillator.
🔶 SETTINGS
Length: Change the calculation lookback length for the oscillator.
Smoothing: Alter the smoothness of the back-end EMA calculations.
Source: Change the source input used for the indicator.
LEXUS - SCALPER v2Overview:
The LEXUS - SCALPER v2 is a powerful trading indicator designed for scalpers who thrive on making quick, precise trades. By leveraging multiple moving averages and fundamental concepts from the BBMA (Bollinger Bands and Moving Averages) strategy, this indicator helps traders accurately identify trends and take advantage of pullbacks to entry.
Key Features:
Multiple Moving Averages: The indicator uses multiple moving averages to identify the trend direction. also the moving averages work in harmony to provide a clear picture of the market’s current state to entry on pullbacks.
BBMA Concepts: By incorporating BBMA principles, the LEXUS - SCALPER v2 enhances trend identification and ensures that trades are made in alignment with market conditions.
Scalping Focus: This indicator is specifically designed for scalping, allowing traders to capitalize on very short-term market movements for quick profits.
How It Works:
Trend Identification: The moving averages are used to determine the overall trend. When the moving average is ascending, it indicates a bullish trend. Conversely, when the moving average is descending, it indicates a bearish trend.
Entry Points: The LEXUS - SCALPER v2 marks entry points on the pullbacks with an arrow above or below the closing candle. These arrows signal potential trade opportunities based on the trend and pullbacks.
Exit Points: To manage risk and protect profits, the indicator includes a CUTLOSS line. When the price closes below this line, it signals that it's time to exit the position.
Usage Instructions:
Add the Indicator: Add the LEXUS - SCALPER v2 to your TradingView chart.
Identify Entry Points: Look for arrows on the closing candles, which indicate potential trade opportunities based on pullbacks.
Manage Risk: Pay attention to the CUTLOSS line. If the price closes below this line, exit the position to minimize losses.

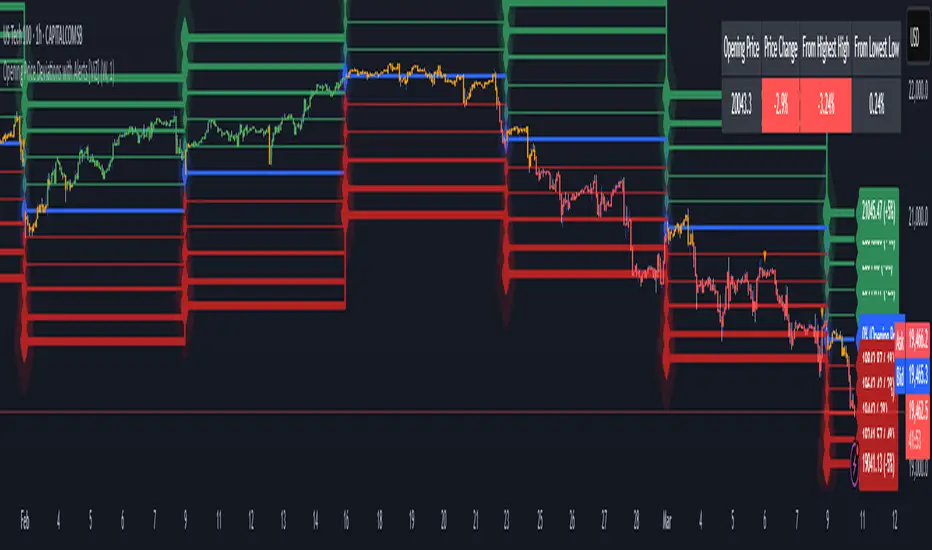
Opening Price Deviations with AlertsOverview
The Timeframe Opening Price Deviations indicator helps traders visualize how price deviates from a key reference point—the opening price of a selected timeframe (Daily, Weekly, or Monthly). It calculates upper and lower deviation levels based on a percentage step and plots these levels on the chart. This can help traders identify potential areas of support and resistance.
----------------------------------------------------------------------------------------------------------------------
How It Works
Opening Price Reference:
The script retrieves the opening price of the selected timeframe (Daily, Weekly, or Monthly).
Deviation Levels Calculation:
Five upper and lower deviation levels are calculated based on a percentage step input by the user.
Each level is determined by multiplying the opening price by (1 ± step size).
Visualization
The indicator plots the calculated levels as horizontal lines above and below the opening price.
Labels appear only on the latest bar, displaying the exact price level along with its percentage deviation from the opening price.
User has the option to turn on/off or change the bar colours. If price is within the 1st deviation lines that's considered neutral coloured orange as default. If price is above/below the first deviation levels the bar colours will be green or red.
---------------------------------------------------------------------------------------------------------------------
Potential Use Cases
Support & Resistance Zones 🟢🔴
The deviation levels can act as potential areas where price may reverse or consolidate based on historical price behaviour.
Breakout & Reversion Strategies 📈📉
If price breaks above an upper deviation level, it could indicate momentum continuation.
If price rejects from a level, it might suggest a mean reversion opportunity.
Trend Strength Analysis 🔍
The distance between the price and deviation levels can help traders assess whether a trend is strong (moving away from the opening price) or weak (hovering near the opening price).
Intraday vs. Multi-Timeframe Perspective 🕒
By selecting different timeframes (Daily, Weekly, Monthly), traders can align intraday price movements with higher timeframe reference points for added confluence.
---------------------------------------------------------------------------------------------------------------------
Customization Options
Timeframe Selection: Choose between Daily, Weekly, or Monthly opening prices.
Deviation Step (%): Adjust the step size to control the spacing between deviation levels.
Colour Bars: User Is able to change the colour of the bars.
---------------------------------------------------------------------------------------------------------------------
Alerts
This Indicator also has alerts for when price crosses above/below a deviation line. It will tell you the ticker, price and time
---------------------------------------------------------------------------------------------------------------------
Final Notes
This indicator is purely for technical analysis and should not be used as a standalone trading system. It works best when combined with price action, volume analysis, or other indicators of you're choosing to refine trade decisions.
Happy Trading! 🚀📊
---------------------------------------------------------------------------------------------------------------------
This explanation is clear, informative, and compliant with TradingView’s House Rules.
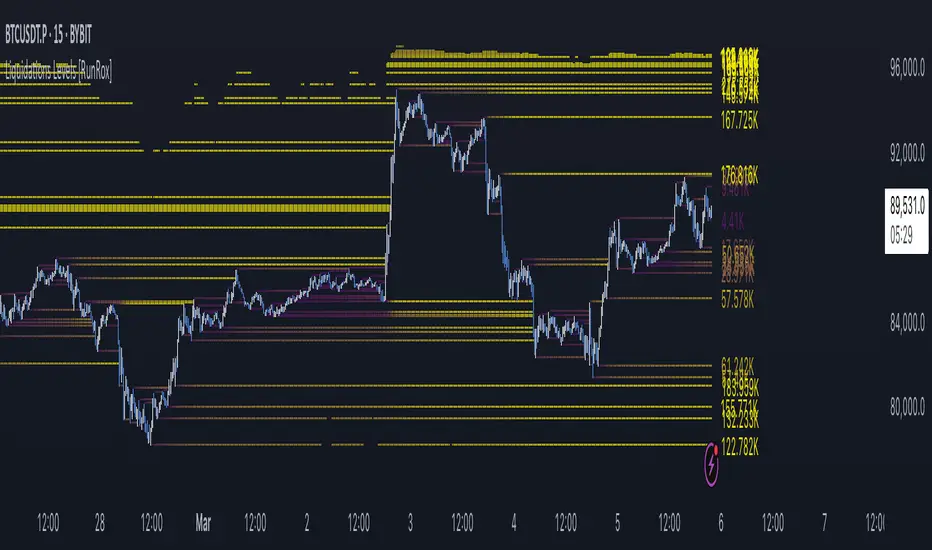
Liquidations Levels [RunRox]📈 Liquidation Levels is an indicator designed to visualize key price levels on the chart, highlighting potential reversal points where liquidity may trigger significant price movements.
Liquidity is essential in trading - price action consistently moves from one liquidity area to another. We’ve created this free indicator to help traders easily identify and visualize these liquidity zones on their charts.
📌 HOW IT WORKS
The indicator works by marking visible highs and lows, points widely recognized by traders. Because many traders commonly place their stop-loss orders beyond these visible extremes, significant liquidity accumulates behind these points. By analyzing trading volume and visible extremes, the indicator estimates areas where clusters of stop-loss orders (liquidity pools) are likely positioned, giving traders valuable insights into potential market moves.
As shown in the screenshot above, the price aggressively moved toward Sell-Side liquidity. After sweeping this liquidity level for the second time, it reversed and began targeting Buy-Side liquidity. This clearly demonstrates how price moves from one liquidity pool to another, continually seeking out liquidity to fuel its next directional move.
As shown in the screenshot, price levels with fewer anticipated trader stop-losses are indicated by less vibrant, faded colors. When the lines become more saturated and vivid, it signals that sufficient liquidity - in the form of clustered stop-losses has accumulated, potentially attracting price movement toward these areas.
⚙️ SETTINGS
🔹 Period – Increasing this setting makes the marked highs and lows more significant, filtering out minor price swings.
🔹 Low Volume – Select the color displayed for low-liquidity levels.
🔹 High Volume – Select the color displayed for high-liquidity levels.
🔹 Levels to Display – Choose between 1 and 15 nearest liquidity levels to be shown on the chart.
🔹 Volume Sensitivity – Adjust the sensitivity of the indicator to volume data on the chart.
🔹 Show Volume – Enable or disable the display of volume values next to each liquidity level.
🔹 Max Age – Limits displayed liquidity levels to those not older than the specified number of bars.
✅ HOW TO USE
One method of using this indicator is demonstrated in the screenshot above.
Price reached a high-liquidity level and showed an initial reaction. We then waited for a second confirmation - a liquidity sweep followed by a clear market structure break - to enter the trade.
Our target is set at the liquidity accumulated below, with the stop-loss placed behind the manipulation high responsible for the liquidity sweep.
By following this approach, you can effectively identify trading opportunities using this indicator.
🔶 We’ve made every effort to create an indicator that’s as simple and user-friendly as possible. We’ll continue to improve and enhance it based on your feedback and suggestions in the future.
Avi - Trendlines EnhancedDeveloped from open-source code by © pikusov (Diagonal Supports and Resistances), this indicator provides traders with a robust and visually intuitive method to identify and monitor key support and resistance levels. Its ability to check for multiple test touches, combined with dynamic updates, customizable visuals, and integrated alert systems, makes it an effective tool for comprehensive technical market analysis.
This advanced TradingView Pine Script indicator dynamically detects and draws support and resistance trendlines based on historical pivot points while also checking for multiple test touches. Here’s a detailed summary of its functionality:
Customizable Trendline Detection:
Historical Analysis: Users specify the number of historical bars to examine for identifying pivot points, enabling a deep scan for reliable support and resistance levels.
Pivot Lookback Settings: The primary pivot lookback period (x1) is user-defined, with a secondary period (x2) calculated as half of x1, allowing the indicator to capture both local lows and highs accurately.
Dynamic Trendline Construction and Multiple Test Validation:
Iterative Pivot Pairing: The script uses nested loops to identify pairs of pivot points (lows for support, highs for resistance) and calculates an interpolated price along the line connecting these pivots.
Testing and Updating Trendlines:
The indicator continuously checks whether the price respects the drawn trendlines.
It verifies if the trendlines have been tested multiple times by iterating through historical bars, ensuring that the level holds up under repeated tests.
When a level is retested, the trendline is updated and a test counter is incremented, thereby reinforcing the significance of the support or resistance level.
Visual Customization Options:
Line Appearance: Users can tailor the trendlines with customizable thickness, dash patterns (solid, dotted, or dashed), and specific colors for support and resistance lines.
Label Settings: Labels display the precise price levels (and optionally the number of tests), with configurable sizes and styles, offering clear visual cues on the chart.
Alerting and Confirmation Mechanisms:
Breakout Alerts: The script triggers alerts when the price action breaches a trendline. It differentiates between standard alerts and those that are volume-confirmed—where the volume exceeds a set multiple of the average—thus minimizing false signals.
RSI-Based Bar Coloring: When enabled, the Relative Strength Index (RSI) is computed, and bars at trendline test points are color-coded (dark red for overbought and dark green for oversold conditions), providing immediate visual feedback on market momentum.
Supporting Analytical Tools:
Pivot Labels: The indicator can display pivot labels using built-in functions, marking key pivot highs and lows with their corresponding price values.
Moving Averages: Two customizable moving averages (fast and slow) can be plotted (using either SMA or EMA), helping to contextualize the trendlines within the broader market trend.
Efficient Object Management:
Array-Based Storage and Cleanup: Arrays are used to store drawn objects (lines and labels), and a cleanup routine ensures that outdated objects are removed with every new bar, keeping the chart clutter-free.
Helper Functions: Utility functions such as price_at for interpolating prices along the trendline and round_to_tick for rounding values enhance the script’s precision and usability.

MTF Round Level Reversal [RunRox]🧲 MTF Round Level Reversal is an indicator designed to highlight price levels on the chart where the market encountered significant resistance or support at round numbers, failing to break through large clusters of orders.
In many cases, price revisits these round-number levels to absorb the remaining liquidity, offering potential reversal or continuation trade opportunities.
✏️ EXAMPLE
Here’s an example demonstrating how this indicator works and how its logic is structured:
As shown in the screenshot above, price encountered resistance at round-number levels, clearly reacting off these areas.
Afterward, the market pulled back, presenting opportunities to enter trades targeting these previously established open levels.
This logic is based on the observation that price often seeks to revisit these open round-number levels due to the residual liquidity resting there.
While effective across various markets, this indicator performs particularly well with stocks or assets priced at higher values.
For a level to appear on the chart, price must first encounter a round-number value and clearly reverse from it, leaving a visible reaction on the chart. After this occurs, the indicator will mark this level as fully formed and display it as an active reversal area.
⚙️ SETTINGS
🔷 Timeframe – Choose any timeframe from which you’d like the indicator to source level data.
🔷 Period – Defines the number of candles required on both sides (left and right) to confirm and fully form a level.
🔷 Rounding Level – Adjusts price rounding precision when detecting levels (from 0.0001 up to 5000).
🔷 Color – Customize the color and transparency of displayed levels.
🔷 Line Style – Select the desired line style for level visualization.
🔷 Label Size – Set the font size for the level labels displayed on the chart.
🔷 Move Label to the Right – Move level labels to the right side of the screen for better visibility.
🔷 Label Offset – Specifies how many bars labels should be offset from the chart’s right edge.
🔷 Delete Filled Level – Automatically removes levels from the chart after they’ve been revisited or filled.
🔷 Calculation Bars – Determines the number of recent bars considered when calculating and identifying levels.
🔶 There are numerous ways to apply this indicator in your trading strategy. You can look for trades targeting these round-number levels or identify reversal setups forming at these high-liquidity zones. The key insight is understanding that these levels represent significant liquidity areas, which price frequently revisits and retests.
We greatly appreciate your feedback and suggestions to further improve and enhance this indicator!

Central Pivot Rangeprevious, current and future TF CPR.
The Central Pivot Range (CPR) is a technical indicator that helps traders identify potential support and resistance levels in the stock market. It's used to make trading decisions, such as entry and exit points.

Multi-Filter Momentum OscillatorMulti-Filter Momentum Oscillator
Description
The Multi-Filter Momentum Oscillator is an advanced technical indicator that leverages multiple moving average filters to identify trend strength, momentum shifts, and potential reversal points in price action. This indicator combines a cluster-based approach with momentum analysis to provide traders with a comprehensive view of market conditions.
Key Components
Filter Cluster Analysis: The indicator creates an array of moving averages with different periods using your choice of filter (PhiSmoother, EMA, DEMA, TEMA, WMA, or SMA). These filters form a cluster that helps identify the underlying trend direction.
Composite Score: The relative positions of these filters are analyzed to generate a net score, which represents the overall trend strength and direction.
Signal Line: A smoothed version of the composite score that helps identify momentum shifts.
Four-Color Histogram: Visualizes the relationship between the score and signal line with four distinct colors:
Bright Green (Bullish Rising): Positive momentum that is accelerating
Olive Green (Bullish Falling): Positive momentum that is decelerating
Dark Red (Bearish Rising): Negative momentum that is improving
Bright Red (Bearish Falling): Negative momentum that is worsening
LazyLine Overlay: An additional triple-smoothed WMA that can be displayed on the price chart to visualize the dominant trend.
Trading Applications
Trend Direction: The oscillator's position above or below zero indicates the prevailing trend direction.
Momentum Shifts: The histogram's color changes signal momentum shifts before they become apparent in price.
Divergence Detection: Compare oscillator peaks/troughs with price action to identify potential divergences.
Overbought/Oversold Conditions: Extreme readings near the upper and lower threshold levels can indicate potential reversal zones.
Trend Confirmation: The LazyLine overlay confirms the broader trend direction on the price chart.
Customization Options
The indicator offers extensive customization through multiple parameters:
Filter type selection (PhiSmoother, EMA, DEMA, TEMA, WMA, SMA)
Cluster dispersion and trim settings
Post-smoothing options
Signal line parameters
Threshold levels
Color preferences for various elements
Histogram width and visibility
Optional swing signals with customizable placement
Modes
Trend Strength Mode: Focuses on the directional movement of the filter cluster.
Volatility Mode: Weights the score based on the bandwidth of the filter cluster, making it more responsive during volatile periods.
This versatile oscillator combines elements of trend following, momentum analysis, and volatility assessment to provide traders with actionable signals across different market conditions. The four-color histogram adds another dimension to traditional oscillator analysis by visually representing both the direction and strength of momentum shifts.

OB-MSS-FVG StrategyStrategy Explanation:
Identify the Order Block
Look for the last bearish (red) candle before a sustained rally. This candle represents the Order Block, signaling institutional buying/selling activity.
Confirm the Order Block is validated by a liquidity sweep (price briefly wicks into a prior swing high/low to trigger stop orders before reversing).
Confirm Market Structure Shift (MSS)
A ChoCh (Change of Character) occurs when price breaks a prior swing high in a downtrend (or low in an uptrend).
Validate with upward displacement: A strong bullish candle closing above the Order Block, confirming trend reversal.
Locate High-Probability FVGs
FVG Definition: A 3-candle pattern where the middle candle gaps above/below adjacent candles (e.g., bullish FVG in a downtrend).
Conditions for FVG:
a. Unmitigated: Price hasn’t retested the FVG zone.
b. No close below: If tested, price should not close below the FVG (bullish confirmation).
c. Confluence: FVG aligns with a key level (e.g., trendline, Order Block, or Fibonacci retracement).
d. Prioritize farthest FVG: The earliest FVG after the ChoCh is stronger (less likely to be a retracement trap).
e. Fibonacci Filter: Draw Fib (0–100%) from the swing low to high of the rally. Strong FVGs lie between 0–50%; avoid those above 50%.
f. BOS/ChoCH Confirmation: FVG must form after a Break of Structure (BOS) or ChoCh, alongside a liquidity sweep (e.g., stop runs).
Entry, Stop Loss, and Take Profit
Entry: Enter long when price retests the FVG (preferably in the 0–50% Fib zone) and shows rejection (e.g., bullish pin bar, engulfing).
Stop Loss: Place below the FVG’s low or the Order Block’s low, whichever is lower.
Take Profit: Target the next liquidity zone (prior swing high) or use a trailing stop after a BOS.
Example Scenario
Downtrend: Price sweeps liquidity below a swing low.
MSS: Price rallies, breaks the prior swing high (ChoCh).
FVG Formation: A bullish FVG appears during the rally.
Fib Confluence: FVG lies between 0–50% of the rally’s Fib retracement.
Entry: Price retraces to FVG, bounces with a bullish candle.
Exit: Profit at next swing high or liquidity pool.

Volume Delta Risk ReversalThis ndicator tracks session-based volume delta and displays it in a lower chart panel

[TehThomas] - ICT Volume ImbalanceThis script is a Volume Imbalance (VI) detector and visualizer for use on the TradingView platform. The goal of the script is to automatically identify areas where there are significant imbalances in the volume of trades between consecutive candlesticks and visually highlight these areas. These imbalances can provide traders with valuable insights about the market’s current condition, often signaling potential reversal or continuation points based on price and volume action.
ICT (Inner Circle Trader) Concept of Volume Imbalances
Volume imbalances are a critical concept in the ICT trading methodology. They refer to situations where there is an unusual or significant difference in volume between two consecutive candlesticks, which might indicate institutional or large player activity. According to ICT principles, these imbalances can show us areas of market inefficiency or potential price manipulation. By identifying these imbalances, traders can gain an edge in understanding where the market is likely to move next.
Bullish and Bearish Volume Imbalances:
Bullish Volume Imbalance: This occurs when there is a strong increase in buying pressure, typically indicated by a higher volume on a candle that closes significantly above the previous one, often leaving a gap or larger price movement. The market could be preparing to push higher, and the volume shows a clear shift in buying demand.
Bearish Volume Imbalance:
Conversely, a bearish imbalance occurs when there is a strong increase in selling pressure, typically signaled by a candle that closes significantly lower than the previous one, again with higher volume. This could indicate that large players are offloading positions, and the price is likely to drop further.
Key Features and Functions of the Script
The script automates the process of detecting these volume imbalances and visually marking them on a price chart. Let’s explore its functionality in detail.
1. Inputs Section
The script allows for significant customization through its input options, which help traders adjust the detection and visualization of volume imbalances based on their individual preferences and trading style. Below are the details:
lookback (250 bars): This input specifies the number of bars (or candles) the script should look back when analyzing the volume imbalance. By setting this to 250, the user is looking at the last 250 bars on the chart to detect any significant volume imbalances. This period is adjustable between 50 to 500 bars.
volumeThreshold (1.0 multiplier): This input helps set the sensitivity for identifying volume imbalances. The script compares the volume of the current candle with the previous one, and if the current volume exceeds the previous volume by this threshold multiplier (in this case, 1.0 means at least equal to the previous volume), then it triggers an imbalance. Users can adjust the multiplier to suit different market conditions.
showBoxes (true/false): This toggle determines whether the boxes representing volume imbalances are drawn on the chart. When enabled, the script visually highlights the imbalances with colored boxes.
fillBaseColor (orange with 80% opacity): This is the color setting for the background of the imbalance boxes. A softer color (like orange with opacity) ensures the imbalance is highlighted without obscuring the price action.
borderColor (gray): The color of the border around the imbalance boxes. This adds a visual distinction to make the imbalance areas more visible.
borderWidth (1 pixel): This controls the width of the box's border to adjust how prominent it appears.
rightOffset (30 bars): This input controls how far the imbalance box extends to the right on the chart. It helps users anticipate the potential continuation of the imbalance beyond the current candle.
allowWickOverlap (true/false): This setting allows imbalances to be identified even if the wicks of the two consecutive candlesticks overlap. If set to false, only imbalances where the bodies of the candlesticks don’t overlap are considered.
showBrokenBoxes (true/false): If enabled, once a volume imbalance no longer holds true (i.e., the price breaks through the box), the box is marked as "broken." If disabled, the box is deleted when the imbalance condition no longer applies.
brokenBoxColor (red): This controls the color of the box when it is broken, which can be used as a visual cue that the imbalance was invalidated or no longer valid for analysis.
2. Volume Imbalance Function
This is the core function of the script, where the logic to detect bullish and bearish volume imbalances is implemented.
Bullish Imbalance Condition:
The first condition checks if the low of the current candle is greater than the high of the previous candle. This suggests that the market is moving upward with buying pressure.
The second condition checks whether the volume of the current candle is higher than the previous candle by the volumeThreshold multiplier. If both conditions are satisfied, a bullish imbalance is detected.
Bearish Imbalance Condition:
The first condition checks if the high of the current candle is lower than the low of the previous candle. This suggests downward price action with selling pressure.
The second condition checks whether the current volume exceeds the previous volume by the threshold
Allow Wick Overlap: If allowWickOverlap is set to true, the script will still detect imbalances if the wicks of the two candles overlap (common in volatile markets). If false, imbalances are only considered if the wicks do not overlap.
3. Box Creation and Management
When a volume imbalance is detected, the script creates a box on the chart:
The bullish imbalance box is drawn using the minimum of the open and close of the current bar as the top boundary and the maximum of the open and close of the previous bar as the bottom boundary.
Conversely, the bearish imbalance box is drawn in reverse, using the maximum of the current bar’s open and close as the top boundary and the minimum of the previous bar’s open and close as the bottom boundary.
Once the box is created, it is displayed on the chart with the specified background color, border color, and width.
4. Processing Existing Boxes
After detecting a new imbalance and drawing a box, the script checks whether the box should still remain on the chart:
If the price moves beyond the boundaries of the imbalance box, the box is marked as broken (if showBrokenBoxes is enabled), and its color is changed to red, signifying that the imbalance is no longer valid.
If the box remains intact (i.e., the price has not broken the defined boundaries), the script keeps the box extended to the right as the market continues to evolve.
5. Removing Outdated Boxes
Lastly, the script removes boxes that are older than the specified lookback period. For example, if a box was created 250 bars ago, it will be deleted after that period. This ensures the chart stays clean and only focuses on relevant imbalances.
Why This Script is Useful for Traders
This script is extremely valuable for traders, especially those following the ICT methodology, because it automates the process of detecting market inefficiencies or imbalances that might signal future price action. Here’s why it’s particularly useful:
Identifying Key Areas of Interest: Volume imbalances often point to areas where institutional or large-scale traders have entered the market. These areas could provide clues about the next significant move in the market.
Visualizing Market Structure: By automatically drawing boxes around volume imbalances, the script helps traders visually identify potential areas of support, resistance, or turning points, enabling them to make informed trading decisions.
Time Efficiency: Instead of manually analyzing each candlestick and volume spike, this script does the heavy lifting, saving traders valuable time and allowing them to focus on other aspects of their strategy.
Enhanced Trade Entries and Exits: By understanding where volume imbalances are occurring, traders can time their entries (buying during bullish imbalances and selling during bearish ones) and exits (as imbalances break) more effectively, thus improving their chances of success.
Conclusion
In summary, this script is a powerful tool for traders looking to implement volume imbalance strategies based on the ICT methodology. It automates the identification and visualization of significant imbalances in price and volume, offering traders a clear visual representation of potential market turning points. By customizing the settings, traders can tailor the script to their preferred timeframes and sensitivity, making it a flexible and effective tool for any trading strategy.
__________________________________________
Thanks for your support!
If you found this idea helpful or learned something new, drop a like 👍 and leave a comment, I’d love to hear your thoughts! 🚀
Make sure to follow me for more price action insights, free indicators, and trading guides. Let’s grow and trade smarter together! 📈

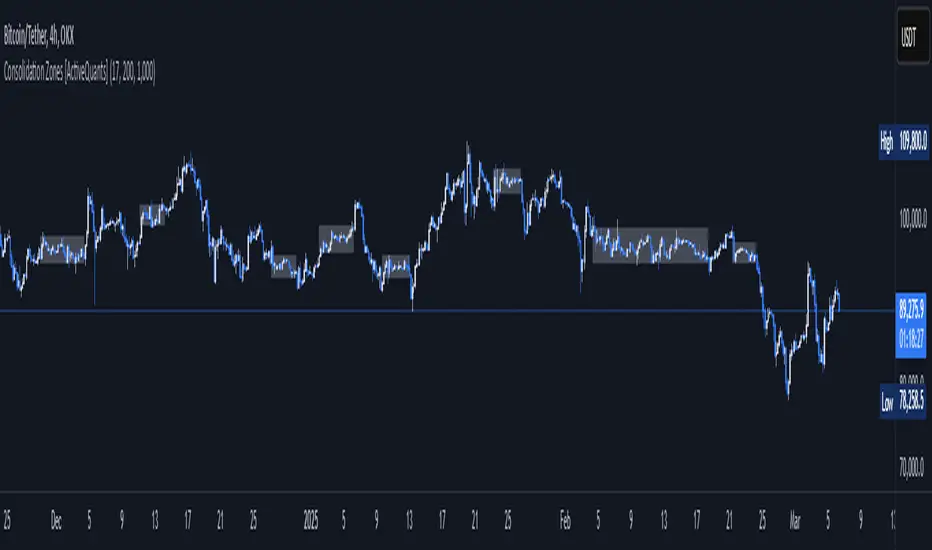
Consolidation Zones [ActiveQuants]The Consolidation Zones indicator is an innovative tool designed to help traders pinpoint periods of low volatility and market balance . By dynamically plotting zones where price action remains confined within an ATR-defined range around a simple moving average (SMA), this indicator highlights periods of consolidation that often precede breakouts or reversals .
█ KEY FEATURES
Dynamic Zone Detection : Automatically identifies consolidation zones when the price remains within a tight range defined by the SMA and ATR over a specified number of bars, signaling balanced market conditions.
Customizable Parameters : Adjust key inputs such as Minimum Zone Length , ATR Length , the number of bars to display, and zone color, enabling you to tailor the indicator to various market conditions and trading styles.
Automated Zone Management : Efficiently plots consolidation zones and cleans up older ones to maintain a clear and focused chart, ensuring you always have an up-to-date view of recent market behavior.
Enhanced Market Analysis : By visualizing areas of price stability, the indicator aids in spotting potential breakout or reversal points, which can be critical for fine-tuning entry and exit strategies.
█ CONCLUSION
The Consolidation Zones indicator is an essential tool for traders who value volatility analysis and precision timing. By marking key periods of price consolidation, it enhances your market analysis, helping you anticipate potential moves and refine your trading strategy.
█ IMPORTANT
⚠ Consolidation signals should be used alongside other technical indicators or analysis techniques such as trend lines, support/resistance levels, or volume to confirm trading decisions.
⚠ Adjust the indicator’s settings based on your preferred timeframe and asset class to achieve the best results.
█ RISK DISCLAIMER
Trading involves significant risk, and you may lose capital. Past performance is not indicative of future results. This tool provides informational signals only and does not constitute financial advice. Use it at your own risk and consult a qualified financial professional before making trading decisions.
Incorporate this indicator into your trading workflow to improve market timing and optimize your entry and exit strategies.
📈 Happy trading! 🚀
MTF Fast Trend Information v.9.1pMulti Time Frame Fast Trend Information (MTF FTI).
The indicator uses Super Trend and Moving Averages to display trend information.
In addition, it shows information based on standard TradingView indicators - RSI, MFI, CCI, OBV, and TSI (The Trend Strength Index indicator measures the tendency of a symbol to either trend steadily or to revert to its mean. The core idea behind TSI is that the more momentum a symbol has relative to its volatility, the more likely it is to follow a trend and the less likely it is to revert to its mean. It analyzes price momentum using the Pearson correlation coefficient, a normalized measure of the linear relationship between time series. Its output shows the correlation between the chart's closing prices and bar index values over a defined number of bars).
Also it shows Chop Zone and ER.
Efficiency Ratio (ER) - It measures the efficiency of price movements. It quantifies how much the price has moved in a given direction relative to its overall volatility. A high ER indicates a strong trend, while a low ER suggests choppy, sideways movement.
ER values scale: H (high), M (medium), L (low).
For more information above ER google KAMA (Kaufman's Adaptive Moving Average).
The Chop Zone indicator allows one to determine whether a market is choppy, showcasing a sideways trend, or not choppy, showcasing a directional trend.
CZ values scale - Red (high values) for the choppy market and Green (low values) for the dominant trend.
CZ can be displayed above or below candles or at the top or bottom of the screen (or turned off). It acts like the standard Chop Zone indicator.
Trend values scale: Up, Down, UP+, Down+. Plus means stronger movement.
TSI values scale: SU (strong up), UP, WU (week up), N+ (above neutral), N (neutral), N- (below neutral), WD (weak down), DN (down), SD (strong down).
CCI, RSI, MFI values scale: OB (over bought), NB (near overbought), WB(weak overbought), N+ (above neutral), N (neutral), N- (below neutral), WO (weak oversold), NO (near oversold), OS (over sold).
VW shows whether the price is above (A) or below (B) VWAP (VWAP is irrelevant for daily or higher time frames).
OBV values scale: BEAR for bearish, BULL for bullish, and NTRL for neutral.
OBV divergence valies scale: HBL (hidden bullish), HBR (hidden bearish), NTR (neutral), RBR/RBL (regular bearich/bullish)
The indicator supports up to seven Time Frames. The more Time Frames it uses, the lower the response time. Five enabled Time Frames are more than enough. You can turn on and off any Time Frame you define.
You can switch between Super Trend and Moving Averages for trend direction detection.
If you encounter a loading problem, refresh the browser and use less enabled Time Frames.

Trend Structure Shift By BCB Elevatebcbelevate.gumroad.com
Trend Structure Shift By BCB Elevate
Overview:
This indicator is a streamlined tool designed to assess the market’s trend structure by pinpointing key price swings. By detecting higher highs and lower lows, the indicator categorizes the market as Bullish, Bearish, or Neutral. Developed by BCB Elevate, it serves as an educational tool for traders seeking to enhance their technical analysis toolkit.
Script Details:
Swing Length Input:
The user can define the “Swing Length” (default is 10 bars) to set the period over which the indicator calculates price extremes.
The script determines the highest high (hh) and the lowest low (ll) within this defined period using ta.highest and ta.lowest functions.
Comparison With Previous Swings:
The script calculates the previous swing’s high (prev_hh) and low (prev_ll) over a period of twice the swing length (using a one-bar offset) to provide a basis for comparison.
If the current highest high exceeds the previous swing’s high, the market is flagged as Bullish.
Conversely, if the current lowest low falls below the previous swing’s low, the market is flagged as Bearish.
If neither condition is met, the market remains Neutral.
Trend Variable and Logical Flow:
A persistent variable trend is declared to store the current trend state.
Using the conditional operator (?:), the script assigns a value of 1 for Bullish, -1 for Bearish, or maintains the previous trend if no new swing condition is met.
Visual Table Display:
The indicator creates a table on the chart to display the current trend status.
The user can choose the table’s position from four options (Top Right, Top Left, Bottom Right, or Bottom Left) to ensure the display aligns with their chart layout.
The table updates dynamically with the text “Bullish,” “Bearish,” or “Neutral” and uses corresponding colors (green for bullish, red for bearish, and gray for neutral) for easy visual interpretation.
Usage & Interpretation:
Input Customization:
Adjust the Swing Length to either capture more granular swings or to smooth out the noise for longer-term trends.
Choose your preferred table position to integrate the indicator seamlessly into your existing chart setup.
Trend Signals:
Bullish Trend: Displayed when a new higher high is identified compared to the previous swing period. This suggests that buyers are in control.
Bearish Trend: Displayed when a new lower low is observed relative to the prior period, indicating selling pressure.
Neutral: Indicates that no significant new swing has been detected, meaning the market may be in a consolidation phase.
Important Notices and Compliance:
Educational Purpose:
This indicator is provided for educational and informational purposes only. It is not intended as financial advice.
Always perform your own analysis or consult with a professional advisor before making any trading decisions.
Final Thoughts:
The "Trend Structure Shift By BCB Elevate" indicator offers a clear, customizable method for evaluating market trends based on price swings. Whether you are a beginner or an experienced trader, understanding these key swing dynamics can enhance your market perspective and assist in making more informed trading decisions.
Happy Trading!


Dynamic Timeframe Trend AnalyzerPurpose and Core Logic
This indicator automatically adjusts its calculations based on the current chart’s timeframe, allowing traders to analyze trends, momentum, and mean reversion opportunities without manually changing indicator settings for each interval. It detects potential long or short setups by combining several techniques:
Dynamic Timeframe Factor
The script compares the current timeframe to a base (e.g., 5 minutes) and calculates a “factor” to scale certain parameters, such as EMA lengths or ATR settings. This reduces the need to reconfigure indicators when switching timeframes.
Regime Detection
It uses ADX (Average Directional Index) to classify the market as strongly trending, moderately trending, choppy, or in a potential mean-reversion phase.
RSI (Relative Strength Index) is also monitored for extreme levels (e.g., overbought/oversold) to detect potential reversal zones.
Volume is compared to a moving average to confirm or refute volatility conditions.
Trend & Mean Reversion Signals
EMA Alignment (8/21/55) helps identify bullish or bearish phases (strong bull if all EMAs align upward, strong bear if aligned downward).
For mean reversion opportunities, the script checks if ADX is sufficiently low (indicating weak or no trend) while price and RSI are at extreme levels—suggesting a snapback or countertrend move may occur.
Dynamic Stop Loss & Take Profit
Uses ATR (Average True Range) to set initial stop-loss (SL) and take-profit (TP) levels, then adjusts these levels further with “regime multipliers” based on whether the market is in a high-volatility trend or a quieter mean-reversion environment.
This approach aims to place stops and targets in a more adaptive way, reflecting current market conditions rather than a one-size-fits-all approach.
Visual Aids
Color-coded chart backgrounds (e.g., greenish for bullish trend, red for bearish, yellow/orange for mean reversion).
Triangles to show recent bullish/bearish signals.
A status table in the top-right corner (optional) displaying key metrics like ADX, RSI, dynamic thresholds, current SL/TP levels, and whether a stop loss has been hit.
How It Works Internally
ADX & Dynamic Thresholds:
A moving average (adx_mean) and standard deviation (adx_std) of the ADX are calculated over a lookback period to define “strong” vs. “weak” ADX thresholds.
This allows the script to adapt to changing volatility and trend strength in different markets or timeframes.
Mean Reversion Criteria:
The indicator checks if price deviates significantly from its own moving average, alongside RSI extremes. If ADX suggests no strong directional push (i.e., the market is “quiet”), it may classify conditions as mean-reverting.
Regime Multipliers:
Once the script identifies the market regime (e.g., strong uptrend, choppy, mean reversion), it applies different multipliers to the user-defined base values for stop-loss and take-profit. For instance, strong trending conditions might allow for wider stops to handle volatility, while mean reversion signals use tighter exits to capture quick reversals.
How to Use It
Timeframe Agnostic
Simply apply it to any timeframe (from 1-minute up to daily or weekly). The “Dynamic Timeframe Factor” will scale the indicator parameters automatically.
Look for Buy/Sell Triangles
When the script detects a valid bullish trend shift or a mean-reversion long setup, it plots a green triangle under the price bar. Conversely, it plots a red triangle above the price bar for bearish or mean-reversion short setups.
Check the Status Table
The table in the top-right corner summarizes the indicator’s current readings: ADX, RSI, volume trends, and the market regime classification.
The table also shows if a stop loss has been hit (SL Hit) and displays recommended SL/TP levels if a signal is active.
Stop Loss & Take Profit
The script plots lines for SL and TP on your chart after a new signal. These lines are automatically adjusted based on ATR, volume conditions, and ADX-derived multipliers.
Mean Reversion vs. Trend-Following
If you see a “Mean Rev” state in the table or the background turning yellow/orange, it suggests potential countertrend trades. Conversely, “STRONG BULL” or “STRONG BEAR” states favor momentum-based entries in the prevailing direction.
Originality & Benefits
Adaptive to Timeframe: Many indicators require reconfiguration when switching from short to long timeframes. This script automates that process using the “timeframe factor” logic.
Regime-Based SL/TP: Instead of fixed risk parameters, the script dynamically tunes stop and target levels depending on whether the market is trending or reverting.
Comprehensive Market View: It combines multiple factors—ADX, RSI, volume, moving averages, and volatility measurements—into a single, integrated framework that categorizes the market regime in real time.
Best Practices & Notes
Timeframes: It typically performs well on intraday timeframes (5m, 15m, 1H) but can also be used for swing trading on 4H or Daily charts.
Settings: The defaults are a good starting point, but you can adjust the base ATR multiplier or ADX lookbacks if you prefer a different balance between sensitivity and stability.
Risk Management: This indicator is not a guarantee of any specific results. Always use proper risk management (position sizing, stop-losses, and diversified strategies).
Alert Conditions: Built-in alert conditions can notify you when a new long or short signal appears, or when a stop loss is triggered.

FinFluential Global M2 Money Supply // Days Offset =The "Global M2 Money Supply" indicator calculates and visualizes the combined M2 money supply from multiple countries and regions worldwide, expressed in trillions of USD.
M2 is a measure of the money supply that includes cash, checking deposits, and easily convertible near-money assets. This indicator aggregates daily M2 data from various economies, converts them into a common USD base using forex exchange rates, and plots the total as a single line on the chart.
It is designed as an overlay indicator aligned to the right scale, making it ideal for comparing global money supply trends with price action or other market data.
Key Features
Customizable Time Offset: Users can adjust the number of days to shift the M2 data forward or backward (from -1000 to +1000 days) via the indicator settings. This allows for alignment with historical events or forward-looking analysis.
Global Coverage Includes:
Eurozone: Eurozone M2 (converted via EUR/USD)
North America: United States, Canada
Non-EU Europe: Switzerland, United Kingdom, Finland, Russia
Pacific: New Zealand
Asia: China, Taiwan, Hong Kong, India, Japan, Philippines, Singapore
Latin America: Brazil, Colombia, Mexico
Middle East: United Arab Emirates, Turkey
Africa: South Africa

Morphine Moving AveragesMorphine Moving Averages (MMA) is a comprehensive technical analysis tool designed to give traders a clear, visual representation of key market trends. Combining several essential indicators into one, MMA includes:
Bollinger Bands (20 SMA, 2 standard deviation): Provides a dynamic range to identify volatility and potential reversals.
VWAP (Volume Weighted Average Price): Offers an average price weighted by volume, helping you assess market trends and potential entry points.
8 SMA: A simple moving average that helps identify short-term trends.
20 EMA: A faster-moving average that responds to recent price changes, ideal for spotting shorter-term momentum.
50 EMA: Represents a medium-term trend, smoothing out price action for better market clarity.
200 EMA: A long-term moving average, widely followed to understand the broader trend and potential support/resistance zones.
Each line is color-coded for quick identification, making it an ideal tool for both short-term and long-term traders who want a comprehensive view of the market's key levels. Use the Morphine Moving Averages indicator to spot trends, reversals, and key support/resistance levels all in one glance!
Make sure you have it pinned to price scale right.
If you have any questions or bugs, feel free to reach out to me on X. x.com

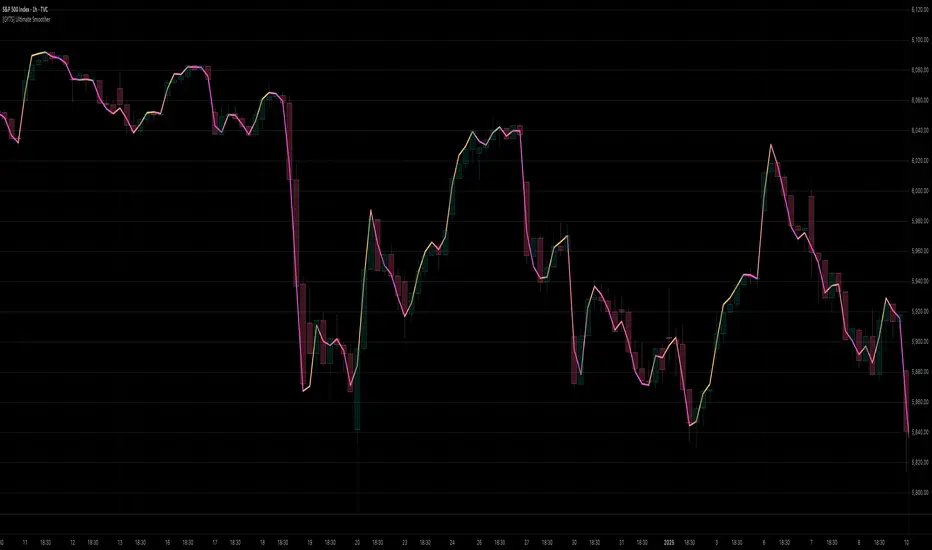
[GYTS] Ultimate Smoother (3-poles + 2 poles)Ultimate Smoother (3-pole)
🌸 Part of GoemonYae Trading System (GYTS) 🌸
🌸 --------- INTRODUCTION --------- 🌸
💮 Release of 3-Pole Ultimate Smoother
This indicator presents a new 3-pole version of John Ehlers' Ultimate Smoother (2024) . This results in an unconventional filter that exhibits effectively zero lag in practical trading applications, regardless of the set period. By using a 2-pole high-pass filter in its design, it responds to price direction changes on the same bar, while still allowing the user to control smoothness.
💮 What is the Ultimate Smoother?
The original Ultimate Smoother is a revolutionary filter designed by John Ehlers (2024) that smooths price data with virtually zero lag in the pass band. While conventional filters always introduce lag when removing market noise, the Ultimate Smoother maintains phase alignment at low frequencies while still providing excellent noise reduction.
💮 Mathematical Foundation
The Ultimate Smoother achieves its remarkable properties through a clever mathematical approach:
1. Instead of directly designing a low-pass filter (like traditional moving averages), it subtracts a high-pass filter from an all-pass filter (the original input data).
2. At very low frequencies, the high-pass filter contributes almost nothing, so the output closely matches the input in both amplitude and phase.
3. At higher frequencies, the high-pass filter's response increasingly matches the input data, resulting in cancellation through subtraction.
The 3-pole version extends this principle by using a higher-order high-pass filter, requiring additional coefficients and handling more terms in the numerator of the transfer function.
🌸 --------- USAGE GUIDE --------- 🌸
💮 Period Parameter Behaviour
The period parameter in the 3-pole Ultimate Smoother works somewhat counterintuitively:
- Longer periods: Result in less smooth, but more responsive following of the price. The filter output more closely tracks the input data.
- Shorter periods: Produce smoother output but may exhibit overshooting (extrapolating price movement) for larger movements.
This is different from most filters where longer periods typically produce smoother outputs with more lag.
💮 When to Choose 3-Pole vs. 2-Pole
- Choose the 3-pole version when you need zero-lag but want to control the smoothness
- Choose the 2-pole version when you are okay with some lag with the benefit of more smoothness.
🌸 --------- ACKNOWLEDGEMENTS --------- 🌸
This indicator builds upon the pioneering work of John Ehlers, particularly from his article April 2024 edition of TASC's Traders' Tips . The original version is published on TradingView by @PineCodersTASC .
This 3-pole extension was developed by @GoemonYae . Feedback is highly appreciated!
Highlight Time ZonesWe can set our specific time zones and highlight those zones, so we can analyze that particular session


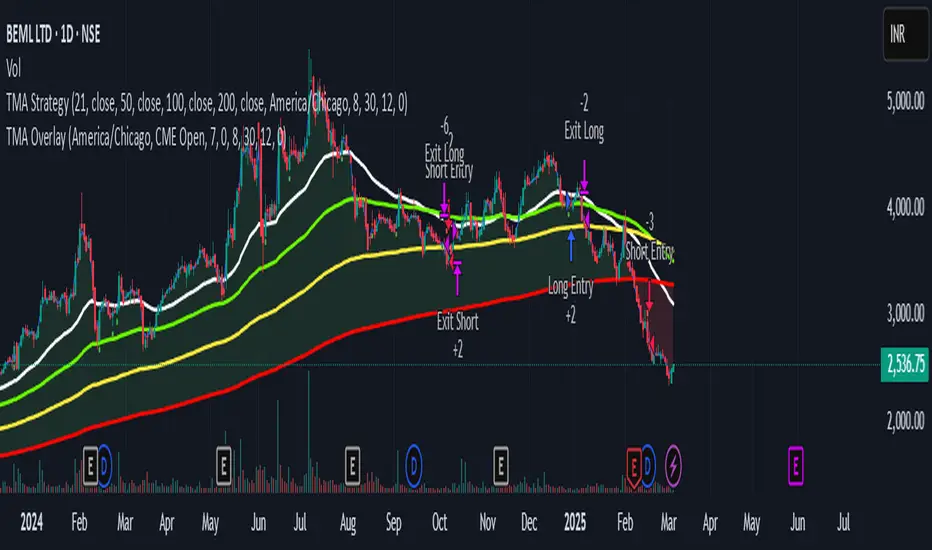
TMA StrategyThe **TMA Strategy** is a trend-following strategy that leverages **Smoothed Moving Averages (SMMA)** and **candlestick patterns** to identify high-probability trading opportunities. It is designed for traders who want to capture strong trends while minimizing noise from short-term fluctuations.
**Key Features:**
✔ **Multiple Smoothed Moving Averages (SMMA):** Uses 21, 50, 100, and 200-period SMMAs to identify market trends and key support/resistance zones.
✔ **Candlestick Pattern Confirmation:** Incorporates **3-line strike** and **engulfing candle** patterns to confirm trade entries.
✔ **Dynamic Trend Filter:** A **2-period EMA** ensures that trades align with the dominant trend, reducing false signals.
✔ **Customizable Session Filter:** Allows users to enable/disable trading within specific market sessions (New York, London, Tokyo, etc.), ensuring trades are executed only during high-liquidity hours.
✔ **Risk Management:** Uses predefined exit conditions based on EMA/SMMA crossovers to lock in profits and minimize losses.
**Trading Logic:**
📌 **Long Entry:**
- Bullish Engulfing or 3-Line Strike pattern appears.
- Price is above the 200 SMMA.
- 2 EMA confirms an uptrend.
- Trade executes if session filter allows.
📌 **Short Entry:**
- Bearish Engulfing or 3-Line Strike pattern appears.
- Price is below the 200 SMMA.
- 2 EMA confirms a downtrend.
- Trade executes if session filter allows.
📌 **Exit Conditions:**
- Long trades exit when EMA(2) crosses **below** SMMA(200).
- Short trades exit when EMA(2) crosses **above** SMMA(200).
**Ideal Markets & Timeframes:**
✅ Best suited for **Forex, Stocks, and Crypto** markets.
✅ Works well on **higher timeframes (15m, 1H, 4H, Daily)** for stronger trend confirmation.
📢 **Disclaimer:**
This strategy is for educational purposes only. Backtest results do not guarantee future performance. Always use proper risk management and test in a demo account before live trading.
🚀 **Try the TMA Strategy now and enhance your trend-following approach!**