Low Liquidity Zones [PhenLabs]📊 Low Liquidity Zones
Version: PineScript™ v6
📌 Description
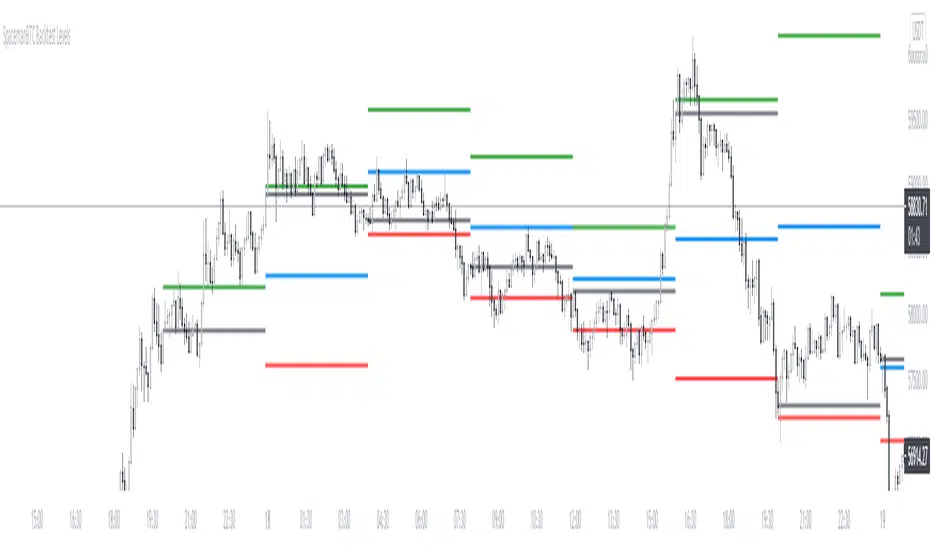
Low Liquidity Zones identifies and highlights periods of unusually low trading volume on your chart, marking areas where price movement occurred with minimal participation. These zones often represent potential support and resistance levels that may be more susceptible to price breakouts or reversals when revisited with higher volume.
Unlike traditional volume analysis tools that focus on high volume spikes, this indicator specializes in detecting low liquidity areas where price moved with minimal resistance. Each zone displays its volume delta, providing insight into buying vs. selling pressure during these thin liquidity periods. This combination of low volume detection and delta analysis helps traders identify potential price inefficiencies and weak structures in the market.
🚀 Points of Innovation
• Identifies low liquidity zones that most volume indicators overlook but which often become significant technical levels
• Displays volume delta within each zone, showing net buying/selling pressure during low liquidity periods
• Dynamically adjusts to different timeframes, allowing analysis across multiple time horizons
• Filters zones by maximum size percentage to focus only on precise price levels
• Maintains historical zones until they expire based on your lookback settings, creating a cumulative map of potential support/resistance areas
🔧 Core Components
• Low Volume Detection: Identifies candles where volume falls below a specified threshold relative to recent average volume, highlighting potential liquidity gaps.
• Volume Delta Analysis: Calculates and displays the net buying/selling pressure within each low liquidity zone, providing insight into the directional bias during low participation periods.
• Dynamic Timeframe Adjustment: Automatically scales analysis periods to match your selected timeframe preference, ensuring consistent identification of low liquidity zones regardless of chart settings.
• Zone Management System: Creates, tracks, and expires low liquidity zones based on your configured settings, maintaining visual clarity on the chart.
🔥 Key Features
• Low Volume Identification: Automatically detects and highlights candles where volume falls below your specified threshold compared to the moving average.
• Volume Delta Visualization: Shows the net volume delta within each zone, providing insight into whether buyers or sellers were dominant despite the low overall volume.
• Flexible Timeframe Analysis: Analyze low liquidity zones across multiple predefined timeframes or use a custom lookback period specific to your trading style.
• Zone Size Filtering: Filters out excessively large zones to focus only on precise price levels, improving signal quality.
• Automatic Zone Expiration: Older zones are automatically removed after your specified lookback period to maintain a clean, relevant chart display.
🎨 Visualization
• Volume Delta Labels: Each zone displays its volume delta with “+” or “-” prefix and K/M suffix for easy interpretation, showing the strength and direction of pressure during the low volume period.
• Persistent Historical Mapping: Zones remain visible for your specified lookback period, creating a cumulative map of potential support and resistance levels forming under low liquidity conditions.
📖 Usage Guidelines
Analysis Timeframe
Default: 1D
Range/Options: 15M, 1HR, 3HR, 4HR, 8HR, 16HR, 1D, 3D, 5D, 1W, Custom
Description: Determines the historical period to analyze for low liquidity zones. Shorter timeframes provide more recent data while longer timeframes offer a more comprehensive view of significant zones. Use Custom option with the setting below for precise control.
Custom Period (Bars)
Default: 1000
Range: 1+
Description: Number of bars to analyze when using Custom timeframe option. Higher values show more historical zones but may impact performance.
Volume Analysis
Volume Threshold Divisor
Default: 0.5
Range: 0.1-1.0
Description: Maximum volume relative to average to identify low volume zones. Example: 0.5 means volume must be below 50% of the average to qualify as low volume. Lower values create more selective zones while higher values identify more zones.
Volume MA Length
Default: 15
Range: 1+
Description: Period length for volume moving average calculation. Shorter periods make the indicator more responsive to recent volume changes, while longer periods provide a more stable baseline.
Zone Settings
Zone Fill Color
Default: #2196F3 (80% transparency)
Description: Color and transparency of the low liquidity zones. Choose colors that stand out against your chart background without obscuring price action.
Maximum Zone Size %
Default: 0.5
Range: 0.1+
Description: Maximum allowed height of a zone as percentage of price. Larger zones are filtered out. Lower values create more precise zones focusing on tight price ranges.
Display Options
Show Volume Delta
Default: true
Description: Toggles the display of volume delta within each zone. Enabling this provides additional insight into buying vs. selling pressure during low volume periods.
Delta Text Position
Default: Right
Options: Left, Center, Right
Description: Controls the horizontal alignment of the delta text within zones. Adjust based on your chart layout for optimal readability.
✅ Best Use Cases
• Identifying potential support and resistance levels that formed during periods of thin liquidity
• Spotting price inefficiencies where larger players may have moved price with minimal volume
• Finding low-volume consolidation areas that may serve as breakout or reversal zones when revisited
• Locating potential stop-hunting zones where price moved on minimal participation
• Complementing traditional support/resistance analysis with volume context
⚠️ Limitations
• Requires volume data to function; will not work on symbols where the data provider doesn’t supply volume information
• Low volume zones don’t guarantee future support/resistance - they simply highlight potential areas of interest
• Works best on liquid instruments where volume data has meaningful fluctuations
• Historical analysis is limited by the maximum allowed box count (500) in TradingView
• Volume delta in some markets may not perfectly reflect buying vs. selling pressure due to data limitations
💡 What Makes This Unique
• Focus on Low Volume: Unlike some indicators that highlight high volume events particularly like our very own TLZ indicator, this tool specifically identifies potentially significant price zones that formed with minimal participation.
• Delta + Low Volume Integration: Combines volume delta analysis with low volume detection to reveal directional bias during thin liquidity periods.
• Flexible Lookback System: The dynamic timeframe system allows analysis across any timeframe while maintaining consistent zone identification criteria.
• Support/Resistance Zone Generation: Automatically builds a visual map of potential technical levels based on volume behavior rather than just price patterns.
🔬 How It Works
1. Volume Baseline Calculation:
The indicator calculates a moving average of volume over your specified period to establish a baseline for normal market participation. This adaptive baseline accounts for natural volume fluctuations across different market conditions.
2. Low Volume Detection:
Each candle’s volume is compared to the moving average and flagged when it falls below your threshold divisor. The indicator also filters zones by maximum size to ensure only precise price levels are highlighted.
3. Volume Delta Integration:
For each identified low volume candle, the indicator retrieves the volume delta from a lower timeframe. This delta value is formatted with appropriate scaling (K/M) and displayed within the zone.
4. Zone Management:
New zones are created and tracked in a dynamic array, with each zone extending rightward until it expires. The system automatically removes expired zones based on your lookback period to maintain a clean chart.
💡 Note:
Low liquidity zones often represent areas where price moved with minimal participation, which can indicate potential market inefficiencies. These zones frequently become important support/resistance levels when revisited, especially if approached with higher volume. Consider using this indicator alongside traditional technical analysis tools for comprehensive market context. For best results, experiment with different volume threshold settings based on the specific instrument’s typical volume patterns.
Indicador Pine Script®