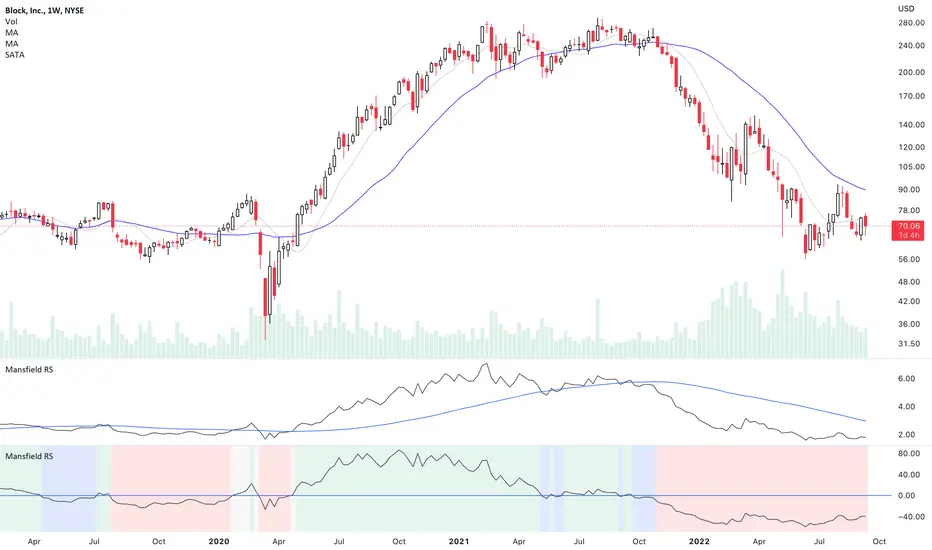
Mansfield Relative Strength (Original Version) by stageanalysisThe Mansfield Relative Strength ( Mansfield RS ) is one of the core components of the Stan Weinstein's Stage Analysis method as discussed in his classic book Stan Weinstein's Secrets for Profiting in Bull and Bear Markets .
The Mansfield RS measures the relative performance of the stock compared to an index such as the S&P 500, or to another stock etc.
However, this should not to be confused with the popular RSI (Relative Strength Index developed J. Welles Wilder), which is a momentum oscillator that measures the speed and change of price movements on a single stock.
The Mansfield RS indicator consists of the Relative Strength comparison line versus the S&P 500 (default universal setting, but can be edited), and the "Zero Line" – which is the 52 week MA of the Relative Strength line, that's been flattened to create the oscillator style.
How to use the Indicator:
Outperforming – Above the Zero Line
When the Relative Strength line crosses above the Zero Line (it's flattened 52 week RS MA), it is outperforming the index or stock that it's comparing against, and so it is showing stronger relative strength.
Underperforming – Below the Zero Line
When the Relative Strength line crosses below the Zero Line (it's flattened 52 week RS MA), it is underperforming the index or stock that it's comparing against, and so it is showing weaker relative strength.
Settings:
When you first add the indicator is has a coloured background, with a green tint for a postive RS score, and a red tint for a negative RS score. However, this can be turned off, or edited in the indicator settings, in the Style tab. So you can change the colors or remove it and just have the RS line and zero line showing. Both of which can also be edited in the settings.
Change the symbol that it compares against. The default is the S&P 500. But for crypto you might want to use Bitcoin for example. Or you might want to compare against competing stocks in the same peer group, or against the industry group or sector. The choice is yours. But the S&P 500 is a universal measure for the Mansfield RS. So I would recommend leaving it on that unless you have a particular reason to change it as mentioned.
MA Length is also an editable setting. This creates the Zero Line. So it will affect the values of the Mansfield RS if you change it. 52 is the default setting, and is set as such for the weekly chart. So I'd recommend not editing it on the weekly chart, but for other timeframes, different settings can be used.
Relativestrength
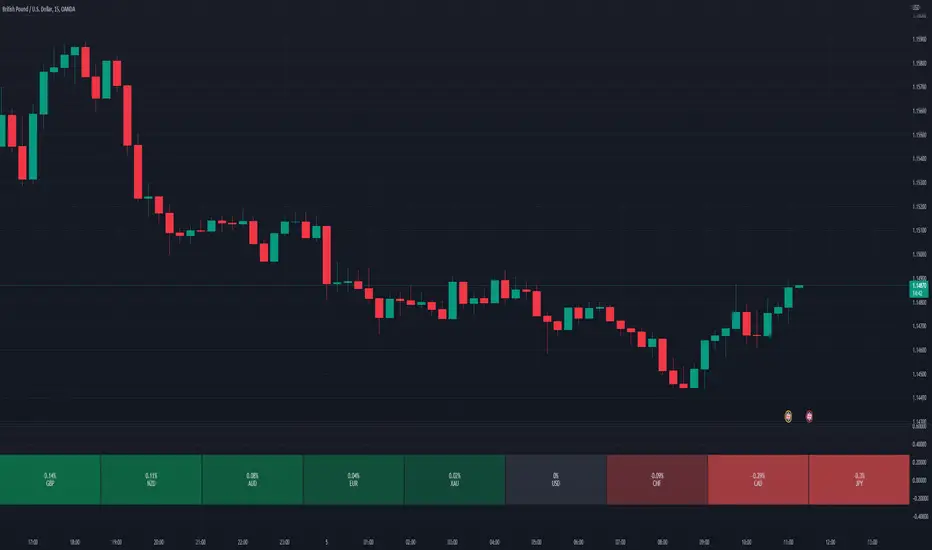
Relative Perfomance IndexHello Traders.
Lets keep it simple..
1. Take the major pairs that have USD in them and watch their change over a specific timeframe.
2. Now lets sort these changes of each pair from the most positive to the most negative.
Good, I see you have some ideas already.
This is exactly what this indicator does. You will visualize the biggest change in pairs of the timeframe of your choice and from this you can decide on pairs that you want to trade.
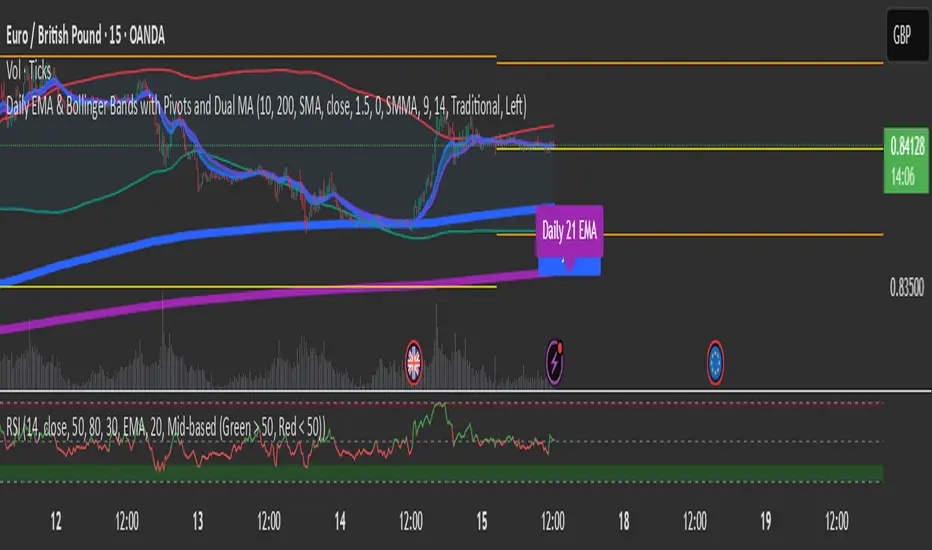
RSI mid partition color changeWhen RSI is above 50 our default bias is on buy side and when below 50 our bias is on sell side.
Therefore created 2 zones for easy identification.
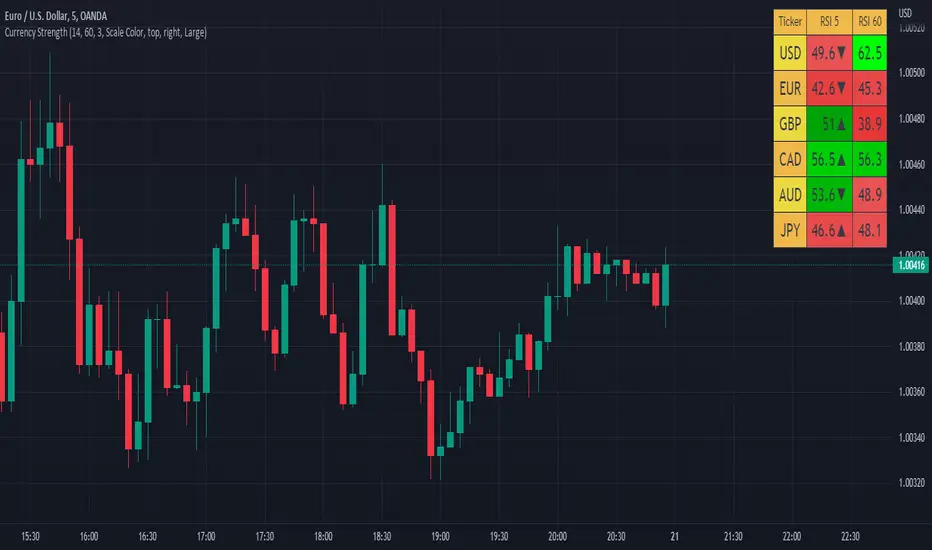
Currency Strength V2An update to my original Currency Strength script to include a 2nd timeframe for more market context.
Changed the formatting slightly for better aesthetics, as the extra column and colors became unsightly.
Also added a new setting for "Flat Color", which changes the value background to a simple green/red for above or below 50, rather than using the Color Scale that increases color intensity the further it gets from 50.
________________________________________________________________________________
This script measures the strength of the 6 major currencies USD, EUR, GBP, CAD, AUD and JPY.
Simply, it averages the RSI values of a currency vs the 5 other currencies in the basket, and displays each average RSI value in a table with color coding to quickly identify the strongest and weakest currencies over the past 14 bars (or user defined length).
The arrow in the current RSI column shows the difference in average RSI value between current and X bars back (user defined), telling you whether the combined RSI value has gone up or down in the last X bars.
Using the average RSI allows us to get a sense of the currency strength vs an equally weighted basket of the other majors, as opposed to using Indexes which are heavily weighted to 1 or 2 currencies.
The additional security calls for the extra timeframe make this slower to load than the original, but this was a user request so hopefully it will prove worthwhile for some people.
Those who find the loading too slow when switching between charts may be better off still using the original, which is why this is posted as a separate script and not an update to the original.
This is the table with Flat Color option enabled.
Dynamic Relative StrengthMainly this indicator is a Relative strength indicator which tells us about the strength of a scrip as compared to an index . That is it outperforming the index or underperforming . Outperformance signifies Strength and Under performance signifies Weakness .Inspired from Bharat trader's Relative Strength of a stock , but changing the period for all time frames is a hassle so i have set 10 period for Monthly and 52 period for Weekly. As for monthly we need around 10 months data or we can use 12 as 1 year has 12 months but 10 works best . used 52 period for Weekly time frame because there are 52 weeks in a year. These values are by default dynamically applied to the indicator when weekly or monthly timeframes are chosen . Daily Period can be chosen as per anyone's need . As can be seen in provided screenshot , that the stock has recently started gaining strength on weekly a compared to Small cap100 index . So we can conclude that it has more strength than the overall index it is representing so more chances of outperformance will be there.

PharshK RSI and Zigzag with H/LIt is with RSI level
and Zigzag Pattern that Market goes on Maximum level and Lower Level
And it is also Showing High and Law Level of last Moving Candle so it is easy to entry and Hold

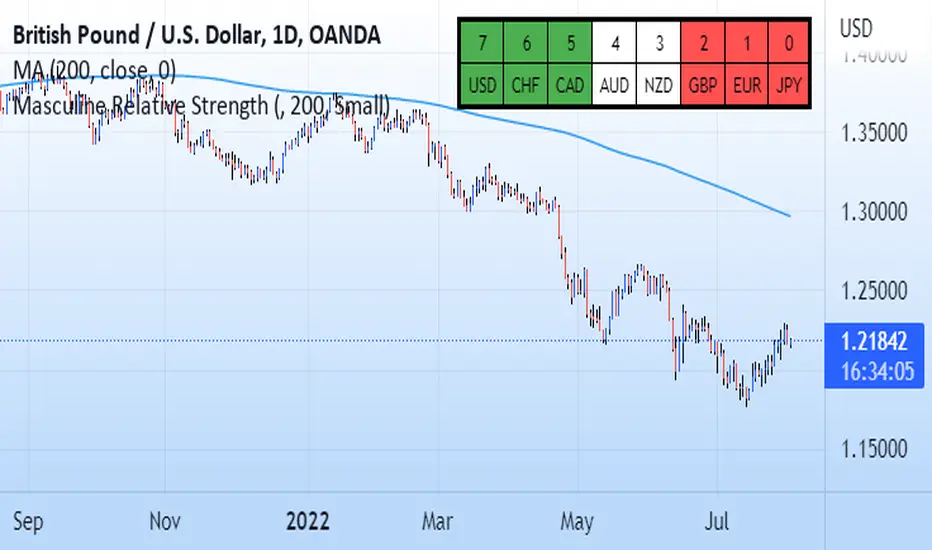
Masculine Relative StrengthThis relative strength indicator compares the G8 currencies against each other in all 28 combinations. It uses the 200 period moving average as a scoring system. For example on eurusd if current price action is above the MA that is +1 for the eur and -1 for the dollar and the inverse is applied if current price is under the 200 ma. The higher the number the stronger the currency. The weaker the number the weaker the currency. Pair the strongest currency with the weakest. This indicator does not guarentee profits and past performance does not guarentee the same future results.
Banknifty Volume - IN
This simple indicator computes the average Relative Strength Index of each Banknifty stock and displays the volume on the chart with color schemes while the average line indicates the average RSI of all Bank Stocks. This indicator works on Banknifty and its stocks.
It works on all time frames
How You can use this?
You can use this indicator for Volume analysis if the average RSI line is above the 0 line, the stock is moving upside and vice versa for Downside .

Candle Strength IndicatorThe candle strength indicator depicts the average strength of the price action by evaluating bullish vs bearish candles.
The scale is relative to price fluctuation and the size of the candles for the particular ticker / market, so there are no significant levels.
A cross on the zero line would generally indicate a change in trend / sentiment.
This indicator may be useful as a filter for entries and use in confluence with other indicators.

RS Compare IndicatorRelative Strength Breakout is always a great indicator of change in trends. This indicator is a visual attempt to show the region of outperformance of a stock with respect to a sector or primary indicator.
The color indicated should read as below
1) Color Red: Indicates that the selected script is underperforming the indexing with which it is compared
2) Color Yellow: Indicates that the selected script is as per the indexing with which it is compared.
3) Color Green: Indicates that the script is outperforming the indexing with which it is compared.

Overlay Mini Plot(s) of Correlated Asset(s)Overlay a small plot of a correlated asset of your choosing. Shrink/expand, Set vertical and horizontal position, plot multiple mini-plots via duplicate indicators with varied settings.
Plots the last X bars of any asset; including the live candle currently painting
Useful for low time frame trading when you want to see correlated asset price movement right alongside the price movement you're watching.
Useful for quick and simple comparisons; when you don't want the clutter of split screen or multi-pane view.
Useful for backtesting.
Price scale agnostic; just plots the shape of the recent price action, with several optional labels: Asset+timeframe | Live Price | Highest price over X bars | Lowest price over X bars.
Works fine with all the assets i've tested it on.
~~User inputs~~
-number of bars to paint.
-horizontal offset: plot to right X bars or to left X bars
-vertical offset: shift up or down, shrink or expand; by using 2 'spacer' inputs
-color/transparancy of candles and price labels.
-width (pixels) of candle bodies.
-choose to display price labels or not
-choose to display asset label or not
~~Tips~~
--Add several of these indicators; changing the vertical 'Shift/Shrink' settings on each to visually separate them.
--In the above chart or EurUsd, there are three indicators =>> three mini-plots overlaid: DXY, EurGbp and GbpUsd. Using the following settings for Space Above:Space Below: DXY- 0.1:4.5 | EurGbp- 1.8:1.8 | GbpUsd- 4.5:0.1
--the more you add, the more you'll have to vertically shrink the plots
© twingall

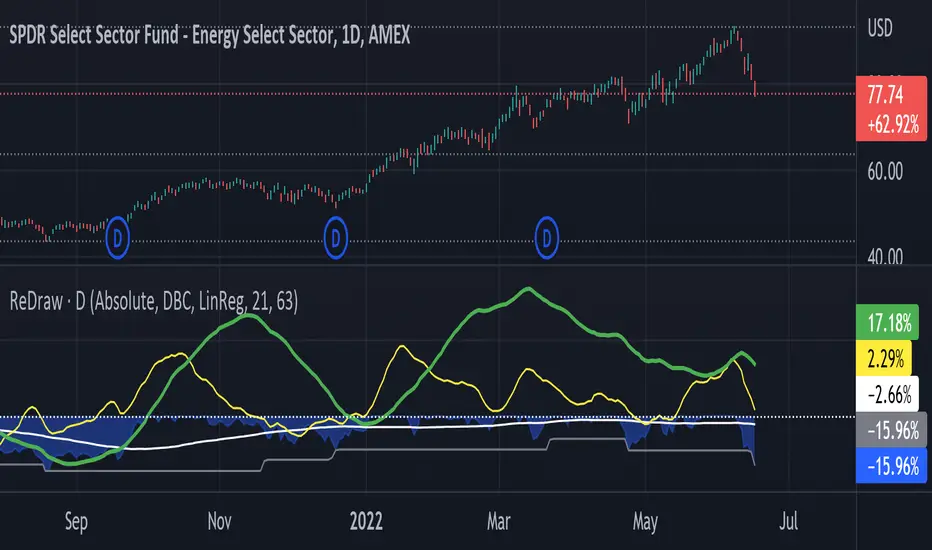
Return & Drawdown
ReDraw script calculates the historical returns and drawdown for the given periods.
By default, the return of the linear regression trends is displayed (can be turned off in settings). In this mode, two linear regression trends are being computed for both long and short periods, and the percent value indicates the "return of the trend" for the corresponding period. Observing the dynamic of the linear regression trends can give a great hint if the trend is slowing down.
When the smoothing method is set to "none" or WMA3/5, the real asset return is shown for both periods, using the formula (LastPrice-FirstPrice)/FirstPrice
The script calculates the maximum drawdown for the long period using the formula (max(Price) - LastPrice) / max(Price).
The white line under the zero is the average maximum drawdown over the long period.
When the mode is set to Compare, ReDraw will display the difference in metrics between the current and selected symbol (SPY by default).
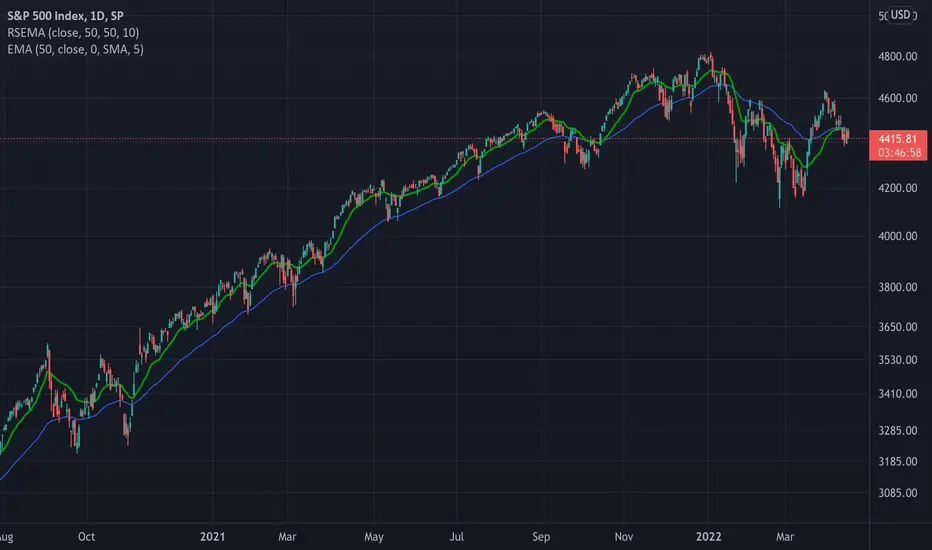
Adaptive, Relative Strength EMA (RSEMA) [Loxx]TASC's May 2022 edition Traders' Tipsl includes the "Relative Strength Moving Averages" article authored by Vitali Apirine. This is the code implementing the Relative Strength Exponential Moving Average (RS EMA) indicator introduced in this publication.
This indicator adds onto Vitali Apirine's work by including three different types of momentum used to calculate RSEMA as well as fixed and adaptive cycle calculations to be used as dynamic inputs to calculate momentum. The purpose of these additional calculation methods is to attempt to filter out noice and track trends by using different methods and inputs to calculation momentum.
Momentum methods
-Wilder relative strength
-Chande momentum
-Momentum component of Jurik's RSX RSI
Cycle calculation methods
-Fixed
-Vertical horizontal filter
-Ehlers' Autocorrelation Dominant Cycle
What is Wilder relative strength?
The Relative Strength Index (RSI), developed by J. Welles Wilder, is a momentum oscillator that measures the speed and change of price movements. The RSI oscillates between zero and 100. Traditionally the RSI is considered overbought when above 70 and oversold when below 30.
What is Chande momentum?
Chande Momentum was designed specifically to track the movement and momentum of a security. It calculates the difference between the sum of both recent gains and recent losses, then dividing the result by the sum of all price movement over the same period.
What is the momentum component of Jurik's RSX RSI?
RSI is a very popular technical indicator, because it takes into consideration market speed, direction and trend uniformity. However, the its widely criticized drawback is its noisy (jittery) appearance. The Jurk RSX retains all the useful features of RSI , but with one important exception: the noise is gone with no added lag. For our purposes here, we derive momentum minus the lag.
Vertical horizontal filter?
Vertical Horizontal Filter (VHF) was created by Adam White to identify trending and ranging markets. VHF measures the level of trend activity, similar to ADX in the Directional Movement System. Trend indicators can then be employed in trending markets and momentum indicators in ranging markets.
What is autocorrelation?
Ehlers Autocorrelation is used in the calculation of dominant cycle length to be injected into standard technical analysis tools to improve TA accuracy. Its main purpose is to eliminate noise from the price data, reduce effects of the “spectral dilation” phenomenon, and reveal dominant cycle periods.
As the first step, Autocorrelation uses Mr. Ehlers’s previous installment, Ehlers Roofing Filter, in order to enhance the signal-to-noise ratio and neutralize the spectral dilation. This filter is based on aerospace analog filters and when applied to market data, it attempts to only pass spectral components whose periods are between 10 and 48 bars.
Autocorrelation is then applied to the filtered data: as its name implies, this function correlates the data with itself a certain period back. As with other correlation techniques, the value of +1 would signify the perfect correlation and -1, the perfect anti-correlation.
Happy trading!

RSI Scalping & Swing Signals With AlertsThis RSI indicator shows a green or red ribbon when the smoothed RSI is bullish or bearish. It also includes a long moving average for overall trend confirmation. Wait until the ribbon holds above or below the long moving average and take positions in that direction.
To get an easier to read RSI indicator, I smoothed the RSI out and paired it next to a short term RMA. These two together form the ribbon that will show you early reversals and trend direction. The long moving average is used as an overall trend detector and confirmation for longer term trends.
***HOW TO USE***
Scalping: Enter longs when the ribbon turns green and enter shorts when the ribbon turns red. Exit positions when the ribbon turns the opposite color or crosses the long moving average.
Swing Trading: When the ribbon holds above the long moving average or breaks out and retests it, look for long positions and exit when the ribbon turns red or crosses the long moving average. When the ribbon holds below the long moving average or breaks down and retests it, look for short positions and exit when the ribbon turns green or crosses the long moving average.
***DETAILS***
This indicator gives early reversal signals very well and waiting for the RSI ribbon to cross the long moving average helps to get you into positions when the market is ready to really move while filtering out some of the noise.
The ribbon and background will change to green or red depending on whether it is currently bullish or bearish.
There is also a label that changes colors and tells you if RSI is bullish or bearish and also whether the RSI ribbon is above or below the long moving average.
Green or red circles will appear on the indicator when there is a bullish or bearish cross of the RSI ribbon and the long moving average.
It also has alerts that trigger when RSI is turning bullish/bearish or when the RSI ribbon is crossing the long moving average.
***CUSTOMIZATION***
Each piece of this indicator can be customized to suit your preferences including the RSI source, length, smoothing length, short moving average length and long moving average length. You can also turn off the labels, signals and long moving average. All of these settings can be managed within the indicator settings input tab.
***MARKETS***
This indicator can be used as a signal on all markets, including stocks, crypto, futures and forex.
***TIMEFRAMES***
This RSI Scalping & Swing Signals indicator can be used on all timeframes.
***TIPS***
Try using numerous indicators of ours on your chart so you can instantly see the bullish or bearish trend of multiple indicators in real time without having to analyze the data. Some of our favorites are Trend Friend Scalp & Swing Trade Signals, Volume Spike Scanner, Buy & Sell Pressure Volume Profile, and Momentum Scalper in combination with this RSI indicator. They all have real time Bullish and Bearish labels as well so you can immediately understand each indicator's trend.

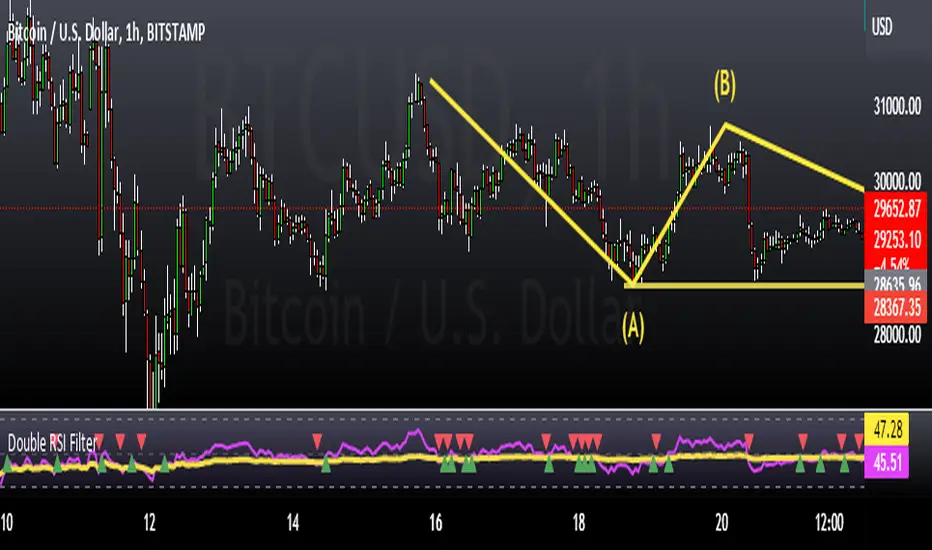
Double RSI FilterI've seen several youtubers using 2 RSI's on top of one another to filter trades for their strategies. I figured I would just code it up as an all-in-one indicator for people who have the basic package. This way they have an extra slot for another indicator if they need one and also for convenience.
Longs only when RSI 1 is above RSI 2 and shorts only when opposite. The arrows show where crosses of the RSI's occur.
Let me know if there is something else like this where it would just be very convenient to have 2 indicators on one window or other such things and I'll see if I can do something for you guys in my spare time. I'm just an amateur coder, but learning as I do more of these for people.
Thank you!
Hope this helps someone! :)
Custom Multi-Timeframe IndicatorIt's a pretty simple example of a nice custom screener you can run for multiple timeframes. This is an RSI screener, but you can easily change the function for your own Indicator.
Screener displays:
Last value of the instrument
RSI value for up to 10 instruments / 4 timeframes.
In Parameters you can change:
4 timeframes
10 instruments
Parameters for RSI
Styling parameters for table
If the selected timeframe will be lower than the current one you will receive a warning message in a table.
Thanks to @MUQWISHI to help me code it.
Disclaimer
Please remember that past performance may not be indicative of future results.
Due to various factors, including changing market conditions, the strategy may no longer perform as well as in historical backtesting.
This post and the script don’t provide any financial advice.

Oversold RSI with tight SL Strategy (by Coinrule)This is one of the best strategies that can be used to get familiar with technical indicators and start to include them in your trading bot rules.
ENTRY
1. This trading system uses the RSI ( Relative Strength Index ) to anticipate good points to enter positions. RSI is a technical indicator frequently used in trading. It works by measuring the speed and change of price movements to determine whether a coin is oversold (indicating a good entry point) or overbought (indicating a point of exit/entry for a short position). The RSI oscillates between 0 and 100 and is traditionally considered overbought when over 70 and oversold when below 30.
2. To pick the right moment to buy, the strategy enters a trade when the RSI falls below 30 indicating the coin is oversold and primed for a trend reversal.
EXIT
The strategy then exits the position when the price appreciates 7% from the point of entry. The position also maintains a tight stop-loss and closes the position if the price depreciates 1% from the entry price. The idea behind this is to cut your losing trades fast and let your winners ride.
The best time frame for this strategy based on our backtesting data is the daily. Shorter time frames can also work well on certain coins, however in our experience, the daily works best. Feel free to experiment with this script and test it on a variety of your coins! With our backtesting data a trading fee of 0.1% is taken into account. The fee is aligned to the base fee applied on Binance, which is the largest cryptocurrency exchange by volume. In the example shown, this strategy made a handsome net profit of 39.31% on Chainlink with 61.54% of trades being profitable.

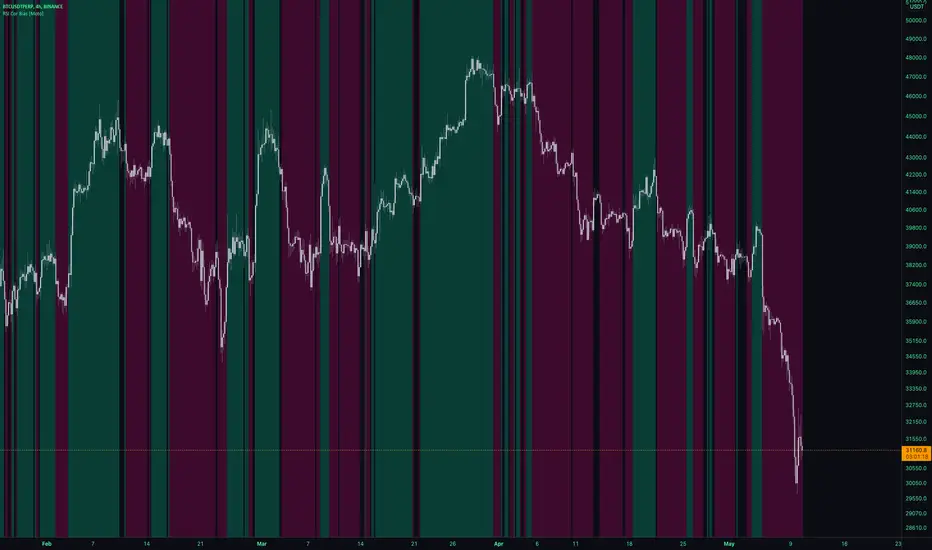
RSI Cor Bias [Moto]Hello traders,
This is a pretty simple script. It gives a background directional bias color respective to RSI levels from input thresholds in the settings. Users can choose the upper and lower thresholds and the symbol that the RSI is from.
For example, by default, the upper threshold is 52 and the lower 48. If Bitcoins RSi is above 52, the background color will be green, below 48 it's pink, between and no color will be applied.
Generally, buying should be occurring in pink to green transition or in green, and conversely selling should be occurring in green to pink transition or in pink.
Thanks,
Moto
Oversold RSI with Tight Stop-Loss Strategy (by Coinrule)KRAKEN:LINKUSD
This is one of the best strategies that can be used to get familiar with technical indicators and start to include them in your rules on Coinrule .
ENTRY
1. This trading system uses the RSI (Relative Strength Index) to anticipate good points to enter positions. RSI is a technical indicator frequently used in trading. It works by measuring the speed and change of price movements to determine whether a coin is oversold (indicating a good entry point) or overbought (indicating a point of exit/entry for a short position). The RSI oscillates between 0 and 100 and is traditionally considered overbought when over 70 and oversold when below 30.
2. To pick the right moment to buy, the strategy enters a trade when the RSI falls below 30 indicating the coin is oversold and primed for a trend reversal.
EXIT
The strategy then exits the position when the price appreciates 7% from the point of entry. The position also maintains a tight stop-loss and closes the position if the price depreciates 1% from the entry price. The idea behind this is to cut your losing trades fast and let your winners ride.
The best time frame for this strategy based on our back testing data is the daily. Shorter time frames can also work well on certain coins, however in our experience, the daily works best. Feel free to experiment with this script and test it on a variety of your coins! With our back testing data a trading fee of 0.1% is taken into account. The fee is aligned to the base fee applied on Binance, which is the largest cryptocurrency exchange by volume. In the example shown, this strategy made a handsome net profit of 52.6% on Chainlink with 66.67% of trades being profitable.
You can execute this strategy on your favorite exchanges with Coinrule .

Stochastic RSI HeatmapStochastic RSI presented as a heatmap starting from the oversold (20) / overbought (80) levels respectively. The more oversold / overbought the price, the more intense the color (blue / fuchsia).

RSI correlation with cryptoindices [strategy version]Dear TV'ers,
Hereby the strategy script where the RSI of an altcoin can be compared to one of the selected cryptocap indices. Included are:
-total market cap
-total market cap minus bitcoin
-total market cap others
-total market cap usdt
-cix100 index
-btc dominance
-btc total cap
If the signal crosses over 1, then the altcoin is undervalued compared to the crypto index (and considered a buying signal here). If the signal crosses under 1, then the altcoin is overvalued compared to the selected crypto-index and a short signal is produced.
!!Please note that the selected timeframe for the reference pair should be a higher time of the chart in order to prevent repainting!!!

Relative Strength Super Smoother by lastguruA better version of Apirine's RS EMA by using a superior MA: Ehlers Super Smoother.
In January 2022 edition of TASC Vitaly Apirine introduced his Relative Strength Exponential Moving Average. A concept not entirely new, as Tushar Chande used a similar calculation for his VIDYA moving average. Both are based on the idea to change EMA length depending on the absolute RSI value, so the moving average would speed up then RSI is going up or down from the center value (when there is a significant directional price movement), and slow down when RSI returns to the center value (when there is a neutral or sideways movement). That way EMA responsiveness would increase where it matters most, but decrease where there is a high probability of whipsaw.
There are only two main differences between VIDYA and RS EMA:
RSI internal smoothing - VIDYA uses SMA, as Chande's CMO is an RSI with SMA; RS EMA uses EMA
Change direction - VIDYA sets the fastest length; RS EMA sets the slowest length
Both algorithms use EMA as the base of their calculation. As John F. Ehlers has shown in his article "Predictive and Successful Indicators" (January 2014 issue of TASC), EMA is not a very efficient filter, as it introduces a significant lag if sufficient smoothing is required. He describes a new smoothing filter called SuperSmoother, "that sharply attenuates aliasing noise while minimizing filtering lag." In other words, it provides better smoothing with lower lag than EMA.
In this script, I try to get the best of all these approaches and present to you Relative Strength Super Smoother. It uses RS EMA algorithm to calculate the SuperSmoother length. Unlike the original RS EMA algorithm, that has an abstract "multiplier" setting to scale the period variance (without this parameter, RSI would only allow it to speed up twice; Vitaly Apirine sets the multiplier to 10 by default), my implementation has explicit lower bound setting, so you can specify the exact range of calculated length.
Settings:
Lower Bound - fastest SuperSmoother length (when RSI is +100 or -100)
Upper Bound - slowest SuperSmoother length (when RSI is 0)
RSI Length - underlying RSI length. Unlike the original RSI that uses RMA as an internal smoothing algorithm, Vitaly Apirine uses EMA, which is approximately twice as fast (that is needed because he uses a generally long RSI length and RMA would be too slow for this). It is the same as the Upper Bound by default (0), as in the original implementation
The original RS EMA is also shown on the chart for comparison. The default multiplier of 10 for RS EMA means that the fastest EMA period is around 4. I use the fastest period of 8 by default. It does not introduce too much of a lag in comparison, but the curve is much smoother.
This script is just an interface for my public libraries. Check them out for more information.

TASC 2022.05 Relative Strength Exponential Moving Average█ OVERVIEW
TASC's May 2022 edition Traders' Tips includes the "Relative Strength Moving Averages" article authored by Vitali Apirine. This is the code implementing the Relative Strength Exponential Moving Average (RS EMA) indicator introduced in this publication.
█ CONCEPTS
RS EMA is an adaptive trend-following indicator with reduced lag characteristics. By design, this was made possible by harnessing the relative strength of price. It operates in a similar fashion to a traditional EMA, but it has an improved response to price fluctuations. In a trading strategy, RS EMA can be used in conjunction with an EMA of the same length to identify the overall trend (see the preview chart). Alternatively, RS EMAs with different lengths can define turning points and filter price movements.
RS EMA is an adaptive trend-following indicator with reduced lag characteristics. By design, this was made possible by harnessing the relative strength of price. It operates in a similar fashion to a traditional EMA, but it has an improved response to price fluctuations.
█ CALCULATIONS
The following steps are used in the calculation process:
• Calculate the relative strength (RS) of a given length.
• Multiply RS by a chosen coefficient (multiplier) to adapt the EMA filtering the original time series. Calculate the EMA of the resulting time series.
The author recommends RS EMA(10,10,10) as typical settings, where the first parameter is the EMA length, the second parameter is the RS length, and the third parameter is the RS multiplier. Other values may be substituted depending on your trading style and goals.