Kuri's 9ema 5/3m Candle Close ScriptCustom Entry Script. Uses 9ema cross on 3 and 5 minute candle confirmations.
Indicadores y estrategias

Moving Average Cross with RSI Confirmation and TargetsMoving Average Cross with RSI Confirmation and Targets

Trend Following Indicator MA NARESHMoving Averages: This script calculates a fast and a slow simple moving average (SMA).
Buy/Sell Signals: A buy signal is generated when the fast MA crosses above the slow MA, and a sell signal is created when it crosses below.
Visuals: The moving averages and signals are plotted on the chart, with buy signals marked below the bars and sell signals above.
Alerts: Alerts are set for both buy and sell signals.
You can adjust the fastLength and slowLength parameters to fit your trading strategy. Let me know if you need any modifications or additional features!

Ido strategy RSI Oversold with MACD Buy Signal Indicator
This indicator combines the Relative Strength Index (RSI) and the Moving Average Convergence Divergence (MACD) to help identify potential buy signals based on oversold conditions and trend reversals. This script is designed for traders looking to identify entry points when an asset is likely undervalued (oversold) and showing bullish momentum.
How It Works
RSI Oversold Detection: The RSI measures the speed and change of price movements. This indicator flags when the RSI falls below 30, signaling that the asset may be oversold. The user can customize the RSI lookback period and the timeframe within which oversold conditions are considered relevant.
MACD Crossover: The MACD line crossing above the Signal line often indicates a shift to bullish momentum. In this script, a buy signal is generated when a MACD bullish crossover occurs after an RSI oversold condition has been met within a user-defined lookback window.
Buy Signal: A green triangle appears below the price chart each time both conditions are met—when the RSI has recently been in oversold territory and the MACD line crosses above the Signal line. This signal suggests that the asset may be positioned for a potential upward trend, providing a visual cue for entry points.
Customizable Settings
RSI Settings: Adjust the RSI source and period length.
MACD Settings: Customize the fast, slow, and signal lengths of the MACD to suit different market conditions.
Lookback Period: Define how many bars back to check for an RSI oversold condition before confirming a MACD crossover.
Visual Elements
Oversold Background Color: The background on the price chart is shaded red whenever the RSI is below 30.
Buy Signal: A green triangle is displayed on the chart to indicate a potential entry point when both conditions are met.
Alerts
This indicator includes optional alerts, allowing traders to receive notifications whenever the conditions for a buy signal are met, making it easier to monitor multiple assets and stay informed of trading opportunities.
This indicator is ideal for traders using a combination of momentum and trend reversal strategies, especially in volatile markets where oversold conditions often precede a trend change.

SMA WMA EMA Bu kod, yatırımcılara fiyat hareketlerini analiz etmelerinde ve alım-satım sinyalleri tespit etmelerinde yardımcı olur. İşte detaylar:
Hareketli Ortalama Hesaplama:
SMA (Basit Hareketli Ortalama): Verilen periyot boyunca fiyatların ortalamasını alır.
EMA (Üstel Hareketli Ortalama): Daha yeni fiyatlara daha fazla ağırlık verir ve daha hızlı tepki verir.
WMA (Ağırlıklı Hareketli Ortalama): Fiyatlara ağırlık verir, ancak en yeni verilere daha fazla ağırlık verir.
Al Sinyalleri:
Fiyat hareketli ortalamalardan herhangi birini yukarı doğru keserse, bu bir "al" sinyali olarak değerlendirilir.
Sat Sinyalleri:
Fiyat hareketli ortalamalardan herhangi birini aşağı doğru keserse, bu bir "sat" sinyali olarak değerlendirilir.
Grafik Üzerinde Gösterim:
Hareketli ortalamalar grafikte renkli çizgilerle gösterilir.
Alım sinyalleri küçük yeşil daireler olarak, satım sinyalleri ise küçük kırmızı daireler olarak grafikte gösterilir.
Bu indikatör, yatırımcılara alım ve satım noktalarını daha kolay tespit etmelerine yardımcı olur ve fiyat hareketlerini daha net bir şekilde görselleştirir.

EMA 20/50/100/150/200 BUY SELLBu kod, belirli periyotlarda Üstel Hareketli Ortalama (EMA) çizgilerini hesaplar ve fiyatın bu çizgilerin üzerinde mi yoksa altında mı olduğunu belirler.
Fiyat, EMA çizgisinin üzerindeyse, çizgi yeşi l renkte gösterilir; altındaysa, kırmızı renkte gösterilir.
Bu gösterge, yatırımcıların fiyat hareketlerini daha kolay analiz etmelerine yardımcı olur ve trend değişimlerini görsel olarak daha net bir şekilde belirlemelerini sağlar. Grafikte fiyatın EMA çizgilerinin üzerinde mi yoksa altında mı olduğunu hızlıca fark edebilirler.


Blue Sniper Binary Options Alerts**Description:**
The *Blue Sniper Strategy* is a trend-following trading script designed to help traders identify and act on high-confidence trade entries in trending markets. By combining the 50 and 200 Exponential Moving Averages (EMAs) with a custom configuration of UT Bot alerts, this script provides a structured approach to trend detection and precise entry timing. The strategy uses multiple layers of analysis to filter out false signals and aim for trades aligned with the prevailing market direction.
**Underlying Methodology and Concept:**
The *Blue Sniper Strategy* is specifically designed for markets with clear directional trends. To achieve this, it uses a two-part methodology: **trend filtering** through EMAs and **entry precision** through UT Bot alerts.
1. **EMA-Based Trend Filtering**
- The 50 and 200 EMAs are used as dynamic indicators of trend direction. The 50 EMA, being shorter-term, captures recent price movements, while the 200 EMA reflects longer-term market sentiment.
- Together, these EMAs establish a directional filter:
- When the 50 EMA is above the 200 EMA, it signals an uptrend.
- When the 50 EMA is below the 200 EMA, it signals a downtrend.
- This alignment helps the strategy confirm trend direction, avoiding entries in weak or choppy trends. Only when the price and EMAs confirm a strong trend does the strategy trigger signals.
2. **UT Bot Alert Precision**
- The UT Bot alerts are configured to detect price action within the established trend, identifying entry points based on momentum. The alerts monitor price for moments when it aligns with the trend’s direction and shows signs of continuation, helping to avoid entry during consolidation or excessive volatility.
- These alerts offer a “second layer” of confirmation, so only setups that satisfy both the EMA trend filter and UT Bot momentum criteria will generate signals, reducing the likelihood of false or poorly timed entries.
**Key Features and Benefits:**
1. **Trend-Focused Structure**
- This strategy is optimized for trending markets. By filtering for strong trends using EMAs, it reduces entry signals during range-bound or erratic conditions. It’s particularly suitable for assets like Forex pairs and other volatile markets where trends are often more pronounced.
2. **Precision Alerts for Entries**
- The UT Bot alerts are fine-tuned for entry precision within the trend. By scanning for momentum-driven price levels, they aim to provide timely entries in alignment with the larger trend. The alerts avoid periods of low volatility or extreme price swings, instead focusing on “sweet spots” where momentum is most likely to follow through.
3. **Versatility in Application**
- While initially designed for Forex pairs, the *Blue Sniper Strategy* adapts well to various markets, including commodities, indices, and crypto. It is also suitable for multiple trading styles:
- **Scalping**: The quick responsiveness of the UT Bot makes it practical for short-term trades within a trend.
- **Day Trading and Swing Trading**: The trend confirmation from the 50 and 200 EMAs supports longer-term entries in established trends.
**How to Use the *Blue Sniper Strategy*:**
1. **Assess Market Conditions Beforehand**
- This strategy is ideal for trending markets. Start by analyzing whether the asset is currently trending, as the script is not optimized for range-bound or highly volatile environments. Checking market structure beforehand helps ensure more reliable signals.
2. **Trend Confirmation with EMAs**
- Ensure alignment with the EMAs before considering an alert:
- **For Buy Signals**: Price should be above both the 50 and 200 EMAs, with the 50 EMA above the 200 EMA. This indicates a solid uptrend.
- **For Sell Signals**: Price should be below both EMAs, with the 50 EMA below the 200 EMA, confirming a downtrend.
- These conditions provide a foundational trend direction, reinforcing that any subsequent alert from the UT Bot aligns with a larger trend movement.
3. **Follow Alerts Mindfully**
- Each alert signals an optimal entry point within the trend, but traders should validate it with overall trend analysis and market conditions. The strategy is designed to highlight high-probability entries, but success will vary with changing market dynamics. Alerts are best used as guidance rather than guarantees.
**Realistic Expectations:**
While this strategy is structured to filter for high-confidence trade setups, it does not guarantee any specific win rate or future performance. Market conditions vary, and like any trading approach, results will depend on broader market factors, trader discretion, and effective risk management. This script does not claim to have a predetermined success rate but aims to improve decision-making by focusing on trends and precise entries.
**Originality and Unique Value:**
The *Blue Sniper Strategy* brings together trend and momentum indicators in a layered, cohesive approach rather than a simple indicator mashup. Each component—EMA trend filtering and UT Bot momentum alerts—serves a distinct purpose, working together to provide reliable signals in trending markets. The script is designed to streamline complex analysis, making it accessible for traders with varying levels of experience, especially those less familiar with Pine Script.
This strategy focuses on offering traders a structured approach that enhances trend and momentum alignment, making it a useful tool for precise, trend-following trades.

EMA + RSI + ML Strategy BeemoneyOnly use this strategy if you want crystal clear buy and sell signals that are incredibly accurate. blue=buy, red=sell. You're welcome....

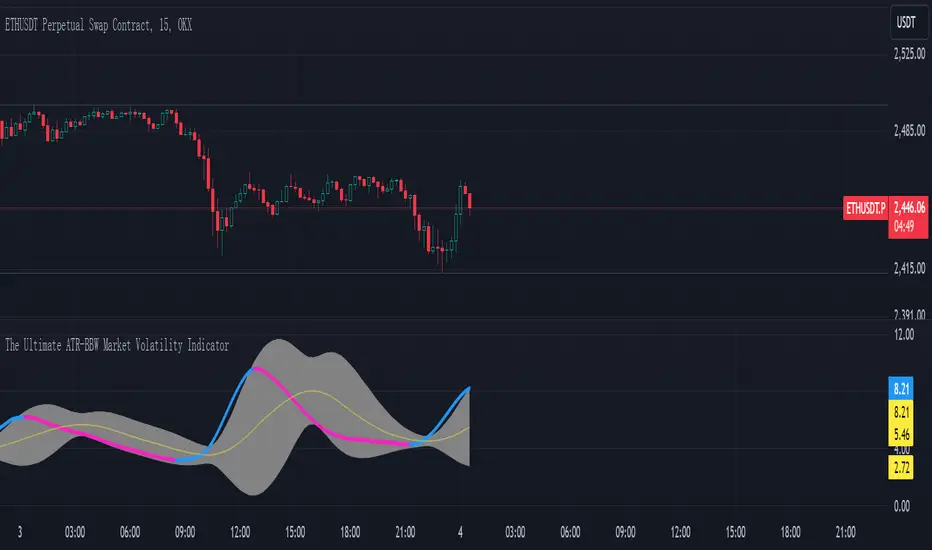
The Ultimate ATR-BBW Market Volatility Indicator"The ATR-BBW Market Volatility Indicator combines the Average True Range (ATR) and Bollinger Bands Width (BBW) to provide a measure of market volatility. This indicator does not indicate bullish or bearish trends, but rather the magnitude of price fluctuations.
* Usage: When the indicator moves upward, it suggests increasing market volatility, indicating that prices are moving within a wider range. Conversely, a downward movement implies decreasing volatility, signifying that prices are moving within a narrower range.
* Note: This sub-indicator solely reflects market volatility and does not provide buy or sell signals.
Investing involves risk. Please conduct thorough research before making any investment decisions.
ATR and BBW Explained:
* Average True Range (ATR): ATR is a technical analysis indicator used to measure market volatility. It calculates the average of a series of true ranges, where the true range is the greatest of the following:
* The current high minus the current low
* The absolute value of the current high minus the previous close
* The absolute value of the current low minus the previous close
* A higher ATR value indicates higher volatility, while a lower value suggests lower volatility.
* Bollinger Bands Width (BBW): Bollinger Bands are plotted two standard deviations above and below a simple moving average. BBW measures the distance between the upper and lower bands. A wider BBW indicates higher volatility, as prices are moving further away from the moving average. Conversely, a narrower BBW suggests lower volatility.
Combining ATR and BBW:
By combining ATR and BBW, the ATR-BBW indicator provides a more comprehensive view of market volatility. ATR captures the overall volatility of the market, while BBW measures the volatility relative to the moving average. Together, they provide a more robust indicator of market conditions and can be used to identify potential trading opportunities.
Why ATR and BBW are Effective for Measuring Volatility:
* ATR directly measures the actual price movement, regardless of the direction.
* BBW shows how much prices are deviating from their average, indicating the strength of the current trend.
* Combined: By combining these two measures, the ATR-BBW indicator provides a more comprehensive and accurate assessment of market volatility.
In essence, the ATR-BBW indicator helps traders understand the magnitude of price fluctuations, allowing them to make more informed trading decisions.
PDV CheckCheca a posição do preço em relação as medias de 21 e 120 exponenciais e 200 simples, mostrando se está acima ou abaixo delas no tempo gráfico selecionado

Long and Short Strategy1Long and Short
Этот базовый скрипт можно модифицировать, добавляя дополнительные индикаторы, фильтры и правила управления рисками для улучшения эффективности стратегии.

BB + SMA120Custom Bollinger Band with SMA Alert Indicator
This script is a customized Bollinger Band indicator with added alerts based on specific conditions related to a 120-period Simple Moving Average (SMA). This indicator is designed for traders who want to receive alerts when certain interactions occur between the Bollinger Bands and the SMA levels, providing potentially valuable signals in trend-following or mean-reversion strategies.
Key Features:
Bollinger Bands Calculation:
The script calculates a standard 25-period Bollinger Band using a customizable standard deviation. The bands consist of an upper, middle (basis), and lower line, allowing traders to observe volatility and potential support/resistance levels.
120 SMA High and Low Levels:
A 120-period SMA of high and low prices is added to the chart, providing a reference for longer-term trend direction and creating a range within which the Bollinger Bands can be evaluated.
Conditional Alerts:
Scenario 1: An alert is triggered when the Bollinger Bands remain above the 120 SMA high and low, and the price taps the lower Bollinger Band. This can be useful for spotting potential buy entries in an uptrend when prices retrace to the lower band.
Scenario 2: An alert is triggered when the Bollinger Bands remain below the 120 SMA high and low, and the price taps the upper Bollinger Band. This may help identify potential sell entries in a downtrend when prices retrace to the upper band.
Visual Aids:
The 120 SMA high and low lines are plotted on the chart with color fills, making it easy to visualize the trend and range boundaries.
Color-coded Bollinger Bands help highlight potential areas of interest based on volatility.
How to Use:
Add this indicator to your chart, configure the Bollinger Band length, and set your alert preferences. Alerts can be managed through TradingView's alert panel, where you can select the scenarios based on price interaction with the bands.
Recommended Use:
This indicator can be helpful for price action traders and mean-reversion strategies in Forex, stocks, and other markets where Bollinger Bands and moving averages are used.
Alerts may provide early signals for potential trade setups, although further confirmation and analysis are advised before entry.

Blue Sniper Binary Options Alerts**Description:**
The *Blue Sniper Strategy* is a trend-following trading script designed to help traders identify and act on high-confidence trade entries in trending markets. By combining the 50 and 200 Exponential Moving Averages (EMAs) with a custom configuration of UT Bot alerts, this script provides a structured approach to trend detection and precise entry timing. The strategy uses multiple layers of analysis to filter out false signals and aim for trades aligned with the prevailing market direction.
**Underlying Methodology and Concept:**
The *Blue Sniper Strategy* is specifically designed for markets with clear directional trends. To achieve this, it uses a two-part methodology: **trend filtering** through EMAs and **entry precision** through UT Bot alerts.
1. **EMA-Based Trend Filtering**
- The 50 and 200 EMAs are used as dynamic indicators of trend direction. The 50 EMA, being shorter-term, captures recent price movements, while the 200 EMA reflects longer-term market sentiment.
- Together, these EMAs establish a directional filter:
- When the 50 EMA is above the 200 EMA, it signals an uptrend.
- When the 50 EMA is below the 200 EMA, it signals a downtrend.
- This alignment helps the strategy confirm trend direction, avoiding entries in weak or choppy trends. Only when the price and EMAs confirm a strong trend does the strategy trigger signals.
2. **UT Bot Alert Precision**
- The UT Bot alerts are configured to detect price action within the established trend, identifying entry points based on momentum. The alerts monitor price for moments when it aligns with the trend’s direction and shows signs of continuation, helping to avoid entry during consolidation or excessive volatility.
- These alerts offer a “second layer” of confirmation, so only setups that satisfy both the EMA trend filter and UT Bot momentum criteria will generate signals, reducing the likelihood of false or poorly timed entries.
**Key Features and Benefits:**
1. **Trend-Focused Structure**
- This strategy is optimized for trending markets. By filtering for strong trends using EMAs, it reduces entry signals during range-bound or erratic conditions. It’s particularly suitable for assets like Forex pairs and other volatile markets where trends are often more pronounced.
2. **Precision Alerts for Entries**
- The UT Bot alerts are fine-tuned for entry precision within the trend. By scanning for momentum-driven price levels, they aim to provide timely entries in alignment with the larger trend. The alerts avoid periods of low volatility or extreme price swings, instead focusing on “sweet spots” where momentum is most likely to follow through.
3. **Versatility in Application**
- While initially designed for Forex pairs, the *Blue Sniper Strategy* adapts well to various markets, including commodities, indices, and crypto. It is also suitable for multiple trading styles:
- **Scalping**: The quick responsiveness of the UT Bot makes it practical for short-term trades within a trend.
- **Day Trading and Swing Trading**: The trend confirmation from the 50 and 200 EMAs supports longer-term entries in established trends.
**How to Use the *Blue Sniper Strategy*:**
1. **Assess Market Conditions Beforehand**
- This strategy is ideal for trending markets. Start by analyzing whether the asset is currently trending, as the script is not optimized for range-bound or highly volatile environments. Checking market structure beforehand helps ensure more reliable signals.
2. **Trend Confirmation with EMAs**
- Ensure alignment with the EMAs before considering an alert:
- **For Buy Signals**: Price should be above both the 50 and 200 EMAs, with the 50 EMA above the 200 EMA. This indicates a solid uptrend.
- **For Sell Signals**: Price should be below both EMAs, with the 50 EMA below the 200 EMA, confirming a downtrend.
- These conditions provide a foundational trend direction, reinforcing that any subsequent alert from the UT Bot aligns with a larger trend movement.
3. **Follow Alerts Mindfully**
- Each alert signals an optimal entry point within the trend, but traders should validate it with overall trend analysis and market conditions. The strategy is designed to highlight high-probability entries, but success will vary with changing market dynamics. Alerts are best used as guidance rather than guarantees.
**Realistic Expectations:**
While this strategy is structured to filter for high-confidence trade setups, it does not guarantee any specific win rate or future performance. Market conditions vary, and like any trading approach, results will depend on broader market factors, trader discretion, and effective risk management. This script does not claim to have a predetermined success rate but aims to improve decision-making by focusing on trends and precise entries.
**Originality and Unique Value:**
The *Blue Sniper Strategy* brings together trend and momentum indicators in a layered, cohesive approach rather than a simple indicator mashup. Each component—EMA trend filtering and UT Bot momentum alerts—serves a distinct purpose, working together to provide reliable signals in trending markets. The script is designed to streamline complex analysis, making it accessible for traders with varying levels of experience, especially those less familiar with Pine Script.
This strategy focuses on offering traders a structured approach that enhances trend and momentum alignment, making it a useful tool for precise, trend-following trades.

only 200-40ema.....Gotta just check the resultsGoing long when the price crosses 200ema and close when the price goes below 40 ema.Just to test the outcomes.


RSI with Short and Long EMAIntroduction
This indicator overlays two Exponential Moving Averages (EMAs) directly onto the Relative Strength Index (RSI) to help traders identify momentum changes and potential trend shifts. The RSI (Relative Strength Index) is a popular momentum oscillator that measures the speed and change of price movements, generally used to spot overbought and oversold levels. Adding EMAs on top of the RSI can provide additional insight into RSI trends, smoothing out fluctuations and helping to identify crossovers that indicate potential buy or sell signals.
In this indicator:
Short EMA (default 20-period) is plotted on the RSI to track shorter-term momentum shifts within the RSI.
Long EMA (default 50-period) is used to track longer-term momentum within the RSI, providing a comparison for the shorter EMA.
How to Use
RSI Momentum: The RSI itself, plotted as a blue line, moves between 0 and 100, with 70 and 30 commonly representing overbought and oversold levels. When RSI is above 70, it signals potential overbought conditions, while below 30 signals oversold conditions.
Crossovers:
Bullish Signal: When the Short EMA (green line) crosses above the Long EMA (red line), it suggests increasing momentum and may signal a potential buying opportunity.
Bearish Signal: When the Short EMA crosses below the Long EMA, it indicates decreasing momentum and may signal a potential selling opportunity.
Confirming Trends:
When the RSI is above both EMAs, it often confirms an uptrend in momentum.
Conversely, when the RSI is below both EMAs, it may indicate a downtrend.
Overbought/Oversold Confirmation:
In overbought conditions (RSI > 70), watch for the Short EMA to cross below the Long EMA to confirm a potential pullback.
In oversold conditions (RSI < 30), look for the Short EMA to cross above the Long EMA to signal a potential recovery.
By analyzing these crossovers along with the RSI levels, you can gain insights into trend strength and potential reversals. This indicator is particularly useful for spotting early signs of a trend shift before price action reflects it.

M2 Money Supply vs SPY SpreadSpread between M2 Money Supply and SPY, with Bollinger bands to see when it has become overextended in either direction.

CandlestickPatternsLibrary "CandlestickPatterns"
zigzag(_low, _high, depth, deviation, backstep)
Parameters:
_low (float)
_high (float)
depth (int)
deviation (int)
backstep (int)
getTrend(trendType, currentClose, zz_downtrend, zz_uptrend, ema14, ema28)
Parameters:
trendType (string)
currentClose (float)
zz_downtrend (bool)
zz_uptrend (bool)
ema14 (float)
ema28 (float)
isInside(currentHigh, currentLow, currentClose, currentOpen, prevHigh, prevLow)
Parameters:
currentHigh (float)
currentLow (float)
currentClose (float)
currentOpen (float)
prevHigh (float)
prevLow (float)
checkMorningStar(open0, high0, low0, close0, open1, high1, low1, close1, open2, high2, low2, close2, innerCandleThreshold, closingMinThreshold, closingMaxThreshold, useDojiFilter, dojiSize, downTrend)
Parameters:
open0 (float)
high0 (float)
low0 (float)
close0 (float)
open1 (float)
high1 (float)
low1 (float)
close1 (float)
open2 (float)
high2 (float)
low2 (float)
close2 (float)
innerCandleThreshold (float)
closingMinThreshold (float)
closingMaxThreshold (float)
useDojiFilter (bool)
dojiSize (float)
downTrend (bool)
checkEveningStar(open0, high0, low0, close0, open1, high1, low1, close1, open2, high2, low2, close2, innerCandleThreshold, closingMinThreshold, closingMaxThreshold, useDojiFilter, dojiSize, upTrend)
Parameters:
open0 (float)
high0 (float)
low0 (float)
close0 (float)
open1 (float)
high1 (float)
low1 (float)
close1 (float)
open2 (float)
high2 (float)
low2 (float)
close2 (float)
innerCandleThreshold (float)
closingMinThreshold (float)
closingMaxThreshold (float)
useDojiFilter (bool)
dojiSize (float)
upTrend (bool)
checkHammerPattern(open, high, low, close, bodyAvg, shadowFactor, downTrend)
Parameters:
open (float)
high (float)
low (float)
close (float)
bodyAvg (float)
shadowFactor (float)
downTrend (bool)
checkInvertedHammerPattern(open, high, low, close, bodyAvg, shadowFactor, downTrend)
Parameters:
open (float)
high (float)
low (float)
close (float)
bodyAvg (float)
shadowFactor (float)
downTrend (bool)
checkHangingManPattern(open, high, low, close, bodyAvg, shadowFactor, upTrend)
Parameters:
open (float)
high (float)
low (float)
close (float)
bodyAvg (float)
shadowFactor (float)
upTrend (bool)
checkShootingStarPattern(open, high, low, close, bodyAvg, shadowFactor, upTrend)
Parameters:
open (float)
high (float)
low (float)
close (float)
bodyAvg (float)
shadowFactor (float)
upTrend (bool)
checkLevels(high0, high1, high2, low0, low1, low2, lookbackPeriod)
Parameters:
high0 (float)
high1 (float)
high2 (float)
low0 (float)
low1 (float)
low2 (float)
lookbackPeriod (int)

2 dây EMA (Đường trung bình động theo cấp số mũ) với các thông số bạn đã yêu cầu. Chiến lược này sẽ thực hiện mua khi EMA 22 cắt lên EMA 250 và bán khi EMA 22 cắt xuống EMA 250, với điểm dừng lỗ (SL) được xác định dựa trên giá trung bình của 4 phiên gần nhất. Tỷ lệ R
là 1:2 và có khả năng dời SL lên tới tỷ lệ R
1:10.


ATR Stoploss Finder (multiple lines)This is adapted from the ATR Stoploss Finder by veryfid. I've simply added the option for displaying different multiples of the ATR on the chart simultaneously. This can be useful for quickly identifying various take profit and stoploss points using different multiples of the ATR without having to change indicator settings every time.
