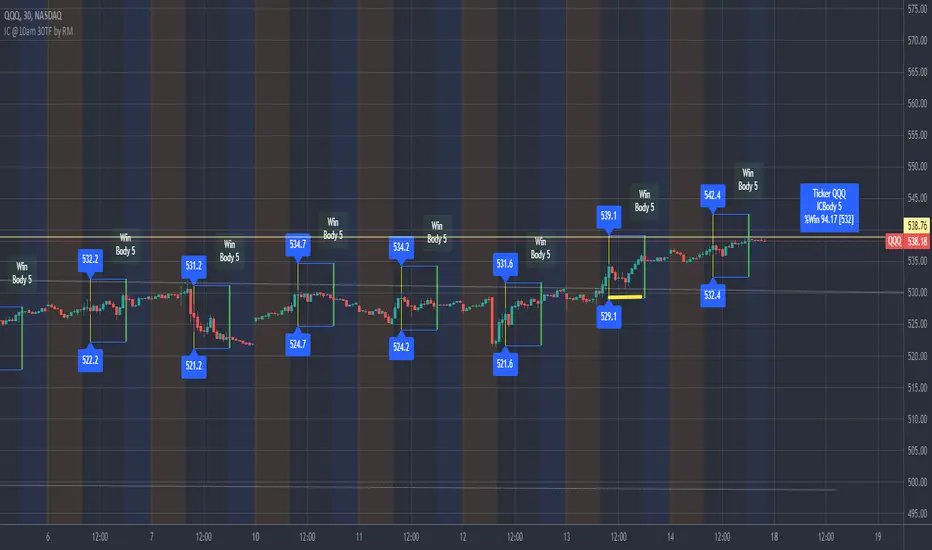
IronCondor 10am 30TF by RMThe IronCondor 10am 30TF indicator shows Iron Condor trades win rate over a large number of days.
The default ETFs in this indicators are "QQQ", "SPY", "RUT" , "CBTX" and "SPX", other entries have not been tested.
Iron Condor quick explanation:
- Iron Condors trades have four options, generally, are based around a Midpoint price (Current Market Price Strike) and
- Two equally distances Strikes for the SELL components (called the Body of the Iron Condor)
- Further away from the two SELLs, another Two BUYs for protection (not considered in this indicator)
- Iron Condors are used for Passive Income based on small gains most of the time.
The IronCondor 10am 30TF has its logic created based on the premises that:
- Most days the market prices stay within a range.
- As example the S&P market prices would stay within 1% on about 80% of the time
- The moving markets (bullish or bearish) occur about 20% of the time
- The biggest market price volatility generally occurs before market opens and then around the first hour or so of trade in the day.
- After the first hour or so of the market the prices would be most likely to stay within a range.
The operation is simple:
- At the Trade Star time in the day (say 10:30 Hrs.) draws a vertical yellow line, then
- Creates two blue horizontal lines for the SELL limits in the Iron Condor Body, at +/- 1% price boundary (check Ticker list below for values)
- At the Trade End time (say 16:00 Hrs.) checks that none of the SELL limits have been broken by highs or lows during the trade day
(The check is done calculating at Trade End time the high/lows 10 bars back for 30 min TF - timeframe)
- There is a label at each Trade End time with Win/Loss and Body value.
- There is one final label with overall calculated past performance in Win percentage out of 'n' trades
Defaults and User Entries:
- The User can modify the Midpoint price called 'IronCondor Midpoint STRIKE' (default is the Candle Close at the selected time)
- The User can modify the Body value called 'IronCondor Body' (default is the Ticker's selected value as per list below)
"QQQ" or "SPY" Body = 5
"RUT" or "CBTX" Body = 20
"SPX" Body = 60
* Disclaimer: This is not a Financial tool, it cannot used as any kind of advice to invest or risk moneys in any market,
Markets are volatile in nature - with little or no warning - and will drain your account if you are not careful.
Use only as an academic demonstrator => * Use at your own risk *
Ironcondor
Intraday Range CalculatorThis indicator shows an easy way to determine if the stock, index or ETF ended within a configurable intraday range.
This solution is ideal for those who study and like Iron Condors or Iron Butterflies strategies.
Results:
If the square is red, it means that the selected deviation limits have been exceeded within the chosen times.
If the square is green, the price stayed within the pre-set limits.
A yellow circle marks the moment when the price leaves the range, either by the upper band or by the lower band.
In the last bar a label with the test results will be displayed.
Settings:
In the configuration there are three fields:
1. Deviation : is the range in percentage that the price can move up or down from the start time to the end time.
2. Begin Time: is the time (in 24h or military format) where the process begins.
3. End Time: is the time (in 24h or military format) where the process ends.
Example:
* for the time 11:00 am, you must enter "1100"
* for the time 2:45pm, you must enter "1445"
Important:
The selected timeframe must be less than 1 hour and Extended Trading Hours in the lower left corner), otherwise the indicator may not show results.
Later I will make an improvement to solve these inconveniences.

Range Gap/Open to Close/Close to CloseThis indicator shows the percentage variation of:
gap
close to close (day including gap)
open to close (without gap)
The green bars represent the days when the variation did not reach the selected range. The red bars show the days when the variation was higher than the selected range.
Best timeframe : DAY

Implied Volatility PercentileThis script calculates the Implied Volatility (IV) based on the daily returns of price using a standard deviation. It then annualizes the 30 day average to create the historical Implied Volatility. This indicator is intended to measure the IV for options traders but could also provide information for equities traders to show how price is extended in the expected price range based on the historical volatility.
The IV Rank (Green line) is then calculated by looking at the high and low volatility over the number of days back specified in the input parameter, default is 252 (trading days in 1 year) and then calculating the rank of the current IV compared to the High and Low. This is not as reliable as the IV Percentile as the and extreme high or low could have a side effect on the ranking but it is included for those that want to use.
The IV Percentile is calculated by counting the number of days below the current IV, then returns this as a % of the days back in the input
You can adjust the number of days back to check the IV Rank & IV Percentile if you are not wanting to look back a whole year.
This will only work on Daily or higher timeframe charts.

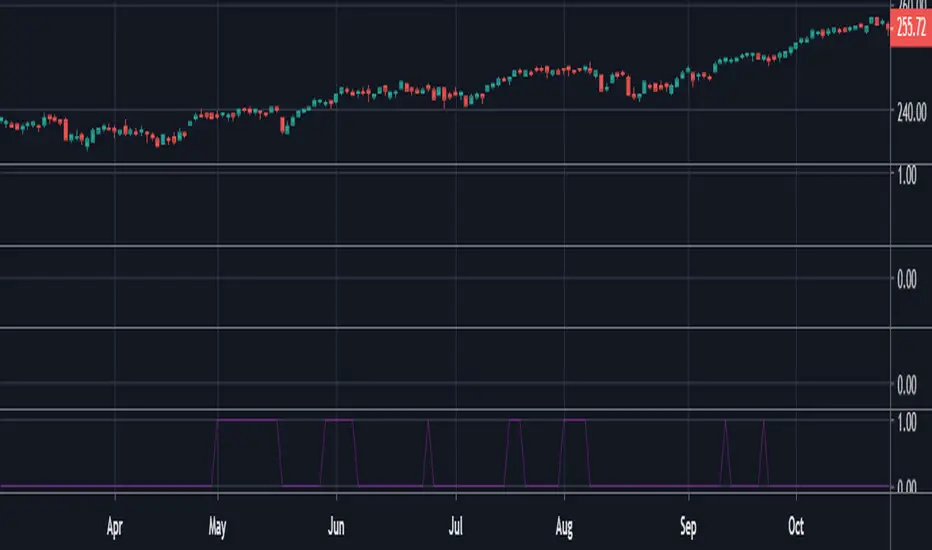
Trading Range Indicator - TRISimple script made to identify trading ranges in any timeframe
The oscillator bounces between 1 and 0. 1 means that the current asset is in a trading range and 0 meaning it is not.
The determination of a trading range is determined by the following:
ATR(14)40 and RSI<60
ADX<25
Due to all 3 having to be fulfilled in order for the oscillator to show there is a trading range, this causes a problem where 2 of the conditions are fulfilled and therefore still shows 0 on the oscillator, however, the asset could very well be in a trading range.
So what in the world do you use this for if there is such a significant margin of error?
Since all 3 conditions need to be fulfilled in order for it to be considered a trading range, this gives a very strong indicator of said trading ranges. So if a person is looking at individual stock tickers or the SPY index ticker, then when the oscillator reads a 1, it could be ideal to open an Iron Condor on said ticker. This means that this indicator is not well suiting for traditional long and short stock positions, but rather it is made for options traders who by using an Iron Condor can make money of a range-bound market.