Alligator + Fractals + Divergent & Squat Bars + Signal AlertsThe indicator includes Williams Alligator, Williams Fractals, Divergent Bars, Market Facilitation Index, Highest and Lowest Bars, maximum and minimum peak of Awesome Oscillator, and signal alerts based on Bill Williams' Profitunity strategy.
MFI and Awesome Oscillator
According to the Market Facilitation Index Oscillator, the Squat bar is colored blue, all other bars are colored according to the Awesome Oscillator color, except for the Fake bars, colored with a lighter AO color. In the indicator settings, you can enable the display of "Green" bars (in the "Green Bars > Show" field). In the indicator style settings, you can disable changing the color of bars in accordance with the AO color (in the "AO bars" field), including changing the color for Fake bars (in the "Fake AO bars" field).
MFI is calculated using the formula: (high - low) / volume.
A Squat bar means that, compared to the previous bar, its MFI has decreased and at the same time its volume has increased, i.e. MFI < previous bar and volume > previous bar. A sign of a possible price reversal, so this is a particularly important signal.
A Fake bar is the opposite of a Squat bar and means that, compared to the previous bar, its MFI has increased and at the same time its volume has decreased, i.e. MFI > previous bar and volume < previous bar.
A "Green" bar means that, compared to the previous bar, its MFI has increased and at the same time its volume has increased, i.e. MFI > previous bar and volume > previous bar. A sign of trend continuation. But a more significant trend confirmation or warning of a possible reversal is the Awesome Oscillator, which measures market momentum by calculating the difference between the 5 Period and 34 Period Simple Moving Averages (SMA 5 - SMA 34) based on the midpoints of the bars (hl2). Therefore, by default, the "Green" bars and their opposite "Fade" bars are colored according to the color of the Awesome Oscillator.
According to Bill Williams' Profitunity strategy, using the Awesome Oscillator, the third Elliott wave is determined by the maximum peak of AO in the range from 100 to 140 bars. The presence of divergence between the maximum AO peak and the subsequent lower AO peak in this interval also warns of a possible correction, especially if the AO crosses the zero line between these AO peaks. Therefore, the chart additionally displays the prices of the highest and lowest bars, as well as the maximum or minimum peak of AO in the interval of 140 bars from the last bar. In the indicator settings, you can hide labels, lines, change the number of bars and any parameters for the AO indicator - method (SMA, Smoothed SMA, EMA and others), length, source (open, high, low, close, hl2 and others).
Bullish Divergent bar
🟢 A buy signal (Long) is a Bullish Divergent bar with a green circle displayed above it if such a bar simultaneously meets all of the following conditions:
The high of the bar is below all lines of the Alligator indicator.
The closing price of the bar is above its middle, i.e. close > (high + low) / 2.
The low of the bar is below the low of 2 previous bars or below the low of one previous bar, and the low of the second previous bar is a lower fractal (▼). By default, Divergent bars are not displayed, the low of which is lower than the low of only one previous bar and the low of the 2nd previous bar is not a lower fractal (▼), but you can enable the display of any Divergent bars in the indicator settings (by setting the value "no" in the " field Divergent Bars > Filtration").
The following conditions strengthen the Bullish Divergent bar signal:
The opening price of the bar, as well as the closing price, is higher than its middle, i.e. Open > (high + low) / 2.
The high of the bar is below all lines of the open Alligator indicator, i.e. the green line (Lips) is below the red line (Teeth) and the red line is below the blue line (Jaw). In this case, the color of the circle above the Bullish Divergent bar is dark green.
Squat Divergent bar.
The bar following the Bullish Divergent bar corresponds to the green color of the Awesome Oscillator.
Divergence on Awesome Oscillator.
Formation of the lower fractal (▼), in which the low of the Divergent bar is the peak of the fractal.
Bearish Divergent bar
🔴 A signal to sell (Short) is a Bearish Divergent bar under which a red circle is displayed if such a bar simultaneously meets all the following conditions:
The low of the bar is above all lines of the Alligator indicator.
The closing price of the bar is below its middle, i.e. close < (high + low) / 2.
The high of the bar is higher than the high of 2 previous bars or higher than the high of one previous bar, and the high of the second previous bar is an upper fractal (▲). By default, Divergent bars are not displayed, the high of which is higher than the high of only one previous bar and the high of the 2nd previous bar is not an upper fractal (▲), but you can enable the display of any Divergent bars in the indicator settings (by setting the value "no" in the " field Divergent Bars > Filtration").
The following conditions strengthen the Bearish Divergent bar signal:
The opening price of the bar, as well as the closing price, is below its middle, i.e. open < (high + low) / 2.
The low of the bar is above all lines of the open Alligator indicator, i.e. the green line (Lips) is above the red line (Teeth) and the red line is above the blue line (Jaw). In this case, the color of the circle under the Bearish Divergent bar is dark red.
Squat Divergent bar.
The bar following the Bearish Divergent bar corresponds to the red color of the Awesome Oscillator.
Divergence on Awesome Oscillator.
Formation of the upper fractal (▲), in which the high of the Divergent bar is the peak of the fractal.
Alligator lines crossing
Bars crossing the green line (Lips) of the open Alligator indicator is the first warning of a possible correction (price rollback) if one of the following conditions is met:
If the bar closed below the Lips line, which is above the Teeth line, and the Teeth line is above the Jaw line, while the closing price of the previous bar is above the Lips line.
If the bar closed above the Lips line, which is below the Teeth line, and the Teeth line is below the Jaw line, while the closing price of the previous bar is below the Lips line.
The intersection of all open Alligator lines by bars is a sign of a deep correction and a warning of a possible trend change.
Frequent intersection of Alligator lines with each other is a sign of a sideways trend (flat).
Signal Alerts
To receive notifications about signals when creating an alert, you must select the condition "Any alert() function is call", in which case notifications will arrive in the following format:
D — timeframe, for example: D, 4H, 15m.
🟢 BDB⎾ - a signal for a Bullish Divergent bar to buy (Long), triggers once after the bar closes and includes additional signals:
/// — if Alligator is open.
⏉ — if the opening price of the bar, as well as the closing price, is above its middle.
+ Squat 🔷 - Squat bar or + Green ↑ - "Green" bar or + Fake ↓ - Fake bar.
+ AO 🟩 - if after the Divergent bar closes, the oscillator color change for the next bar corresponds the green color of the Awesome Oscillator. ┴/┬ — AO above/below the zero line. ∇ — if there is divergence on AO in the interval of 140 bars from the last bar.
🔴 BDB⎿ - a signal for a Bearish Divergent bar to sell (Short), triggers once after the bar closes and includes additional signals:
/// — if Alligator is open.
⏊ — if the opening price of the bar, as well as the closing price, is below its middle.
+ Squat 🔷 - Squat bar or + Green ↑ - "Green" bar or + Fake ↓ - Fake bar.
+ AO 🟥 - if after the Divergent bar closes, the oscillator color change for the next bar corresponds to the red color of the Awesome Oscillator. ┴/┬ — AO above/below the zero line. ∇ — if there is divergence on AO in the interval of 140 bars from the last bar.
Alert for bars crossing the green line (Lips) of the open Alligator indicator (can be disabled in the indicator settings in the "Alligator > Enable crossing lips alerts" field):
🔴 Crossing Lips ↓ - if the bar closed below the Lips line, which is above than the other lines, while the closing price of the previous bar is above the Lips line.
🟢 Crossing Lips ↑ - if the bar closed above the Lips line, which is below the other lines, while the closing price of the previous bar is below the Lips line.
The fractal signal is triggered after the second bar closes, completing the formation of the fractal, if alerts about fractals are enabled in the indicator settings (the "Fractals > Enable alerts" field):
🟢 Fractal ▲ - upper (Bearish) fractal.
🔴 Fractal ▼ — lower (Bullish) fractal.
⚪️ Fractal ▲/▼ - both upper and lower fractal.
↳ (H=high - L=low) = difference.
If you redirect notifications to a webhook URL, for example, to a Telegram bot, then you need to set the notification template for the webhook in the indicator settings in the "Webhook > Message" field (contains a tooltip with an example), in which you just need to specify the text {{message}}, which will be automatically replaced with the alert text with a ticker and a link to TradingView.
‼️ A signal is not a call to action, but only a reason to analyze the chart to make a decision based on the rules of your strategy.
***
Индикатор включает в себя Williams Alligator, Williams Fractals, Дивергентные бары, Market Facilitation Index, самый высокий и самый низкий бары, максимальный и минимальный пик Awesome Oscillator, а также оповещения о сигналах на основе стратегии Profitunity Билла Вильямса.
MFI и Awesome Oscillator
В соответствии с осциллятором Market Facilitation Index Приседающий бар окрашен в синий цвет, все остальные бары окрашены в соответствии с цветом Awesome Oscillator, кроме Фальшивых баров, которые окрашены более светлым цветом AO. В настройках индикатора вы можете включить отображение "Зеленых" баров (в поле "Green Bars > Show"). В настройках стиля индикатора вы можете выключить изменение цвета баров в соответствии с цветом AO (в поле "AO bars"), в том числе изменить цвет для Фальшивых баров (в поле "Fake AO bars").
MFI рассчитывается по формуле: (high - low) / volume.
Приседающий бар означает, что по сравнению с предыдущим баром его MFI снизился и в тоже время вырос его объем, т.е. MFI < предыдущего бара и объем > предыдущего бара. Признак возможного разворота цены, поэтому это особенно важный сигнал.
Фальшивый бар является противоположностью Приседающему бару и означает, что по сравнению с предыдущим баром его MFI увеличился и в тоже время снизился его объем, т.е. MFI > предыдущего бара и объем < предыдущего бара.
"Зеленый" бар означает, что по сравнению с предыдущим баром его MFI увеличился и в тоже время вырос его объем, т.е. MFI > предыдущего бара и объем > предыдущего бара. Признак продолжения тренда. Но более значимым подтверждением тренда или предупреждением о возможном развороте является Awesome Oscillator, который измеряет движущую силу рынка путем вычисления разницы между 5 Периодной и 34 Периодной Простыми Скользящими Средними (SMA 5 - SMA 34) по средним точкам баров (hl2). Поэтому по умолчанию "Зеленые" бары и противоположные им "Увядающие" бары окрашены в соответствии с цветом Awesome Oscillator.
По стратегии Profitunity Билла Вильямса с помощью осциллятора Awesome Oscillator определяется третья волна Эллиота по максимальному пику AO в интервале от 100 до 140 баров. Наличие дивергенции между максимальным пиком AO и следующим за ним более низким пиком AO в этом интервале также предупреждает о возможной коррекции, особенно если AO переходит через нулевую линию между этими пиками AO. Поэтому на графике дополнительно отображаются цены самого высокого и самого низкого баров, а также максимальный или минимальный пик АО в интервале 140 баров от последнего бара. В настройках индикатора вы можете скрыть метки, линии, изменить количество баров и любые параметры для индикатора AO – метод (SMA, Smoothed SMA, EMA и другие), длину, источник (open, high, low, close, hl2 и другие).
Бычий Дивергентный бар
🟢 Сигналом на покупку (Long) является Бычий Дивергентный бар над которым отображается зеленый круг, если такой бар соответствует одновременно всем следующим условиям:
Максимум бара ниже всех линий индикатора Alligator.
Цена закрытия бара выше его середины, т.е. close > (high + low) / 2.
Минимум бара ниже минимума 2-х предыдущих баров или ниже минимума одного предыдущего бара, а минимум второго предыдущего бара является нижним фракталом (▼). По умолчанию не отображаются Дивергентные бары, минимум которых ниже минимума только одного предыдущего бара и минимум 2-го предыдущего бара не является нижним фракталом (▼), но вы можете включить отображение любых Дивергентных баров в настройках индикатора (установив значение "no" в поле "Divergent Bars > Filtration").
Усилением сигнала Бычьего Дивергентного бара являются следующие условия:
Цена открытия бара, как и цена закрытия, выше его середины, т.е. Open > (high + low) / 2.
Максимум бара ниже всех линий открытого индикатора Alligator, т.е. зеленая линия (Lips) ниже красной линии (Teeth) и красная линия ниже синей линии (Jaw). В этом случае цвет круга над Бычьим Дивергентным баром окрашен в темно-зеленый цвет.
Приседающий Дивергентный бар.
Бар, следующий за Бычьим Дивергентным баром, соответствует зеленому цвету Awesome Oscillator.
Дивергенция на Awesome Oscillator.
Образование нижнего фрактала (▼), у которого минимум Дивергентного бара является пиком фрактала.
Медвежий Дивергентный бар
🔴 Сигналом на продажу (Short) является Медвежий Дивергентный бар под которым отображается красный круг, если такой бар соответствует одновременно всем следующим условиям:
Минимум бара выше всех линий индикатора Alligator.
Цена закрытия бара ниже его середины, т.е. close < (high + low) / 2.
Максимум бара выше маскимума 2-х предыдущих баров или выше максимума одного предыдущего бара, а максимум второго предыдущего бара является верхним фракталом (▲). По умолчанию не отображаются Дивергентные бары, максимум которых выше максимума только одного предыдущего бара и максимум 2-го предыдущего бара не является верхним фракталом (▲), но вы можете включить отображение любых Дивергентных баров в настройках индикатора (установив значение "no" в поле "Divergent Bars > Filtration").
Усилением сигнала Медвежьего Дивергентного бара являются следующие условия:
Цена открытия бара, как и цена закрытия, ниже его середины, т.е. open < (high + low) / 2.
Минимум бара выше всех линий открытого индикатора Alligator, т.е. зеленая линия (Lips) выше красной линии (Teeth) и красная линия выше синей линии (Jaw). В этом случае цвет круга под Медвежьим Дивергентным Баром окрашен в темно-красный цвет.
Приседающий Дивергентный бар.
Бар, следующий за Медвежьим Дивергентным баром, соответствует красному цвету Awesome Oscillator.
Дивергенция на Awesome Oscillator.
Образование верхнего фрактала (▲), у которого максимум Дивергентного бара является пиком фрактала.
Пересечение линий Alligator
Пересечение барами зеленой линии (Lips) открытого индикатора Alligator является первым предупреждением о возможной коррекции (откате цены) при выполнении одного из следующих условий:
Если бар закрылся ниже линии Lips, которая выше линии Teeth, а линия Teeth выше линии Jaw, при этом цена закрытия предыдущего бара находится выше линии Lips.
Если бар закрылся выше линии Lips, которая ниже линии Teeth, а линия Teeth ниже линии Jaw, при этом цена закрытия предыдущего бара находится ниже линии Lips.
Пересечение барами всех линий открытого Alligator является признаком глубокой коррекции и предупреждением о возможной смене тренда.
Частое пересечение линий Alligator между собой является признаком бокового тренда (флэт).
Оповещения о сигналах
Для получения уведомлений о сигналах при создании оповещения необходимо выбрать условие "При любом вызове функции alert()", в таком случае уведомления будут приходить в следующем формате:
D — таймфрейм, например: D, 4H, 15m.
🟢 BDB⎾ — сигнал Бычьего Дивергентного бара на покупку (Long), срабатывает один раз после закрытия бара и включает дополнительные сигналы:
/// — если Alligator открыт.
⏉ — если цена открытия бара, как и цена закрытия, выше его середины.
+ Squat 🔷 — Приседающий бар или + Green ↑ — "Зеленый" бар или + Fake ↓ — Фальшивый бар.
+ AO 🟩 — если после закрытия Дивергентного бара, изменение цвета осциллятора для следующего бара соответствует зеленому цвету Awesome Oscillator. ┴/┬ — AO выше/ниже нулевой линии. ∇ — если есть дивергенция на AO в интервале 140 баров от последнего бара.
🔴 BDB⎿ — сигнал Медвежьего Дивергентного бара на продажу (Short), срабатывает один раз после закрытия бара и включает дополнительные сигналы:
/// — если Alligator открыт.
⏊ — если цена открытия бара, как и цена закрытия, ниже его середины.
+ Squat 🔷 — Приседающий бар или + Green ↑ — "Зеленый" бар или + Fake ↓ — Фальшивый бар.
+ AO 🟥 — если после закрытия Дивергентного бара, изменение цвета осциллятора для следующего бара соответствует красному цвету Awesome Oscillator. ┴/┬ — AO выше/ниже нулевой линии. ∇ — если есть дивергенция на AO в интервале 140 баров от последнего бара.
Сигнал пересечения барами зеленой линии (Lips) открытого индикатора Alligator (можно отключить в настройках индикатора в поле "Alligator > Enable crossing lips alerts"):
🔴 Crossing Lips ↓ — если бар закрылся ниже линии Lips, которая выше остальных линий, при этом цена закрытия предыдущего бара находится выше линии Lips.
🟢 Crossing Lips ↑ — если бар закрылся выше линии Lips, которая ниже остальных линий, при этом цена закрытия предыдущего бара находится ниже линии Lips.
Сигнал фрактала срабатывает после закрытия второго бара, завершающего формирование фрактала, если оповещения о фракталах включены в настройках индикатора (поле "Fractals > Enable alerts"):
🟢 Fractal ▲ — верхний (Медвежий) фрактал.
🔴 Fractal ▼ — нижний (Бычий) фрактал.
⚪️ Fractal ▲/▼ — одновременно верхний и нижний фрактал.
↳ (H=high - L=low) = разница.
Если вы перенаправляете оповещения на URL вебхука, например, в бота Telegram, то вам необходимо установить шаблон оповещения для вебхука в настройках индикатора в поле "Webhook > Message" (содержит подсказку с примером), в котором в качестве текста сообщения достаточно указать текст {{message}}, который будет автоматически заменен на текст оповещения с тикером и ссылкой на TradingView.
‼️ Сигнал — это не призыв к действию, а лишь повод проанализировать график для принятия решения на основе правил вашей стратегии.
Index

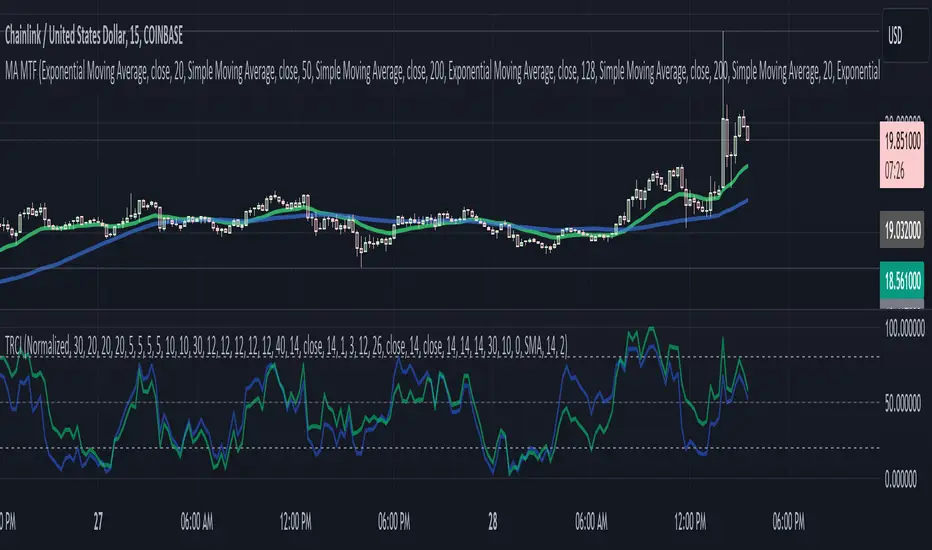
Trend Reversal Composite Index
Overview
The "Trend Reversal Composite Index" (TRCI) is a comprehensive technical analysis tool that combines several indicators to identify potential trend reversals and assess the overall market pulse. The script integrates a variety of technical indicators, including RSI, Stochastic, MACD, Bollinger Bands, Williams %R, OBV, ADX, ATR, and the Relative Volatility Index, each with adjustable weights to fine-tune their influence on the composite scores.
Key Features
Customization : Users can select the "Standardization Type" (Normalized or Z-Score) to standardize indicator values, catering to different analysis preferences.
Composite Scores : The script calculates two main composite scores: the "Trend Reversal Composite" and the "Market Pulse Composite," each derived from a weighted sum of standardized indicator values.
Indicator Weighting : Each indicator's impact on the composite scores can be adjusted through user-defined weights, enabling personalized sensitivity settings.
Dynamic Visuals : The script plots the composite scores and their exponential moving averages (EMAs) on the chart, offering a clear visualization of the market's condition and trend reversals.
Signal Identification : It provides clear "go long" and "go short" signals based on the crossover and crossunder of the composite score and predefined thresholds, assisting in decision-making.
Utility and Originality
TRCI stands out due to its integrative approach, combining multiple indicators into a single composite index. This not only simplifies the analysis by providing a consolidated view of various signals but also enhances the decision-making process by aggregating the predictive power of individual indicators. Its flexibility in customization through adjustable weights and standardization types allows users to tailor the tool according to their trading style and market conditions.
Implementation and Usage
To utilize the TRCI effectively, traders should first experiment with the weights of different indicators based on their trading strategy and the market's volatility. The composite scores offer a straightforward interpretation: higher values may indicate potential buying opportunities, while lower values could signal selling points. The inclusion of EMAs further aids in smoothing out the signals, providing a more reliable indicator of trend direction.
Conclusion
The "Trend Reversal Composite Index" is a versatile and innovative tool for traders looking to streamline their technical analysis and enhance their decision-making process. Its combination of multiple indicators into composite scores, customizable through user-defined weights, makes it a valuable addition to any trader's toolkit.
Grucha Percentage Index (GPI) V2Grucha Percentage Index originally created by Polish coder named Grzegorz Antosiewicz in 2011 as mql code. This code is adapted by his original code to tradingview's pinescript.
What Does it Do
GPI is an oscillator that finds the lowest/highest prices with certain depth and generates signals by comparing the bull and bear bars. It use two lines, one is the original GPI calculation, the other is the smoothed version of the original line.
How to Use
GPI can catch quick volatility based movements and can be used as a confirmation indicator along with your existing trading system. When GDI (default color yellow) crosses above the GDI MA (default colored blue) it can be considered as a bullish movement and reverse can be considered as bearish movement.
How does it Work
The main calculation is done via the code below:
for i=0 to length
if candleC < 0
minus += candleC
if candleC >= 0
plus -= candleC
Simply we are adding green and red bars seperately and then getting their percentage to the bullish movement to reflect correctly in a 0-100 z-score enviroment via the code below:
res = (math.abs(minus)/sum)*100
Rest is all about plotting the results and adding seperate line with smoothing.
Note
These kind of oscillators are not designed to be used alone for signal generation but rather should be used in combination with different indicators to increase reliability of your signals.
Happy Trading.

RSI over screener (any tickers)█ OVERVIEW
This screener allow you to watch up to 240 any tickers you need to check RSI overbought and oversold using multiple periods, including the percentage of RSIs of different periods being overbought/oversold, as well as the average between these multiple RSIs.
█ THANKS
LuxAlgo for his RSI over multi length
I made function for this RSI and screener based on it.
allanster for his amazing idea how to split multiple symbols at once using a CSV list of ticker IDs
█ HOW TO USE
- hide chart:
- add 6 copies of screener
- change list number at settings from 1 to 6
- add you tickers
Screener shows signals when RSI was overbought or oversold and become to 0, this signal you may use to enter position(check other market condition before enter).
At settings you cam change Prefics, Appendix and put you tickers.
limitations are:
- max 40 tickers for one list
- max 4096 characters for one list
- tickers list should be separated by comma and may contains one space after the comma
By default it shows almost all BINANCE USD-M USDT tickers
Also you can adjust table for your screen by changing width of columns at settings.
If you have any questions or suggestions write comment or message.

Supertrended RSI [AlgoAlpha]🚀📈 Introducing the Supertrended RSI Indicator by AlgoAlpha!
Designed to empower your trading decisions, this innovative Pine Script™ creation marries the precision of the Relative Strength Index (RSI) with the dynamic prowess of the SuperTrend methodology. Whether you’re charting the course of cryptos, riding the waves of stock markets, or navigating the futures landscape, our SuperTrended RSI Indicator is your go-to tool for uncovering unique trend insights and crafting trading strategies. 🌟
Key Features:
🔍 Enhanced RSI Analysis: Combines the traditional RSI with a supertrend calculation for a dynamic look at market trends.
🔄 Multiple Moving Averages: Offers a selection of moving averages including SMA, HMA, EMA, and more for tailored analysis.
🎨 Customizable Visuals: Choose your own color scheme for uptrends and downtrends to match your trading dashboard.
📊 Flexible Input Settings: Tailor the indicator with customizable lengths, factors, and smoothing options.
⚡ Real-Time Alerts: Set alerts for bullish and bearish reversals to stay ahead of market movements.
Quick Guide to Using the Supertrended RSI Indicator
Maximize your trading with the Supertrended RSI by following these streamlined steps! 🚀✨
🛠 Add the Indicator: Search for "Supertrended RSI " in TradingView's Indicators & Strategies. Customize settings like RSI length, MA type, and Supertrend factors to fit your trading style.
🎨 Visual Customization: Adjust uptrend and downtrend colors for clear trend visualization.
📊 Market Analysis: Watch for the Supertrend color change for trend reversals. Use the 70 and 30 lines to spot overbought/oversold conditions.
🔔 Alerts: Enable notifications for reversal conditions to capture trading opportunities without constant chart monitoring.
How It Works:
At the core of this indicator is the combination of the Relative Strength Index (RSI) and the Supertrend framework, it does so by applying the SuperTrend on the RSI. The RSI settings can be adjusted for length and smoothing, with the option to select the data source. The Supertrend calculation takes into account a specified trend factor and the Average True Range (ATR) over a given period to determine trend direction.
Visual elements include plotting the RSI, its moving average, and the Supertrend line, with customizable colors for clarity. Overbought and oversold conditions are highlighted, and trend changes are filled with distinct colors.
🔔 Alerts: Enable alerts for crossover and crossunder events to catch every trading opportunity.
🌈 Whether you're a seasoned trader or just starting, the Supertrended RSI offers a fresh perspective on market trends. 📈
💡 Tip: Experiment with different settings to find the perfect balance for your trading style!
🔗 Explore, customize, and enhance your trading experience with the Supertrended RSI Indicator! Happy trading! 🎉

Economic Growth Index (XLY/XLP)Keeping an eye on the macroeconomic environment is an essential part of a successful investing and trading strategy. Piecing together and analysing its complex patterns are important to detect probable changing trends. This may seem complicated, or even better left to experts and gurus, but it’s made a whole lot easier by this indicator, the Economic Growth Index (EGI).
Common sense shows that in an expanding economy, consumers have access to cash and credit in the form of disposable income, and spend it on all sorts of goods, but mainly crap they don’t need (consumer discretionary items). Companies making these goods do well in this phase of the economy, and can charge well for their products.
Conversely, in a contracting economy, disposable income and credit dry up, so demand for consumer discretionary products slows, because people have no choice but to spend what they have on essential goods. Now, companies making staple goods do well, and keep their pricing power.
These dynamics are represented in EGI, which plots the Rate of Change of the Consumer Discretionary ETF (XLY) in relation to the Consumer Staples ETF (XLP). Put simply, green is an expanding phase of the economy, and red shrinking. The signal line is the market, a smoothed RSI of the S&P500. Run this on a Daily timeframe or higher. Check it occasionally to see where the smart money is heading.

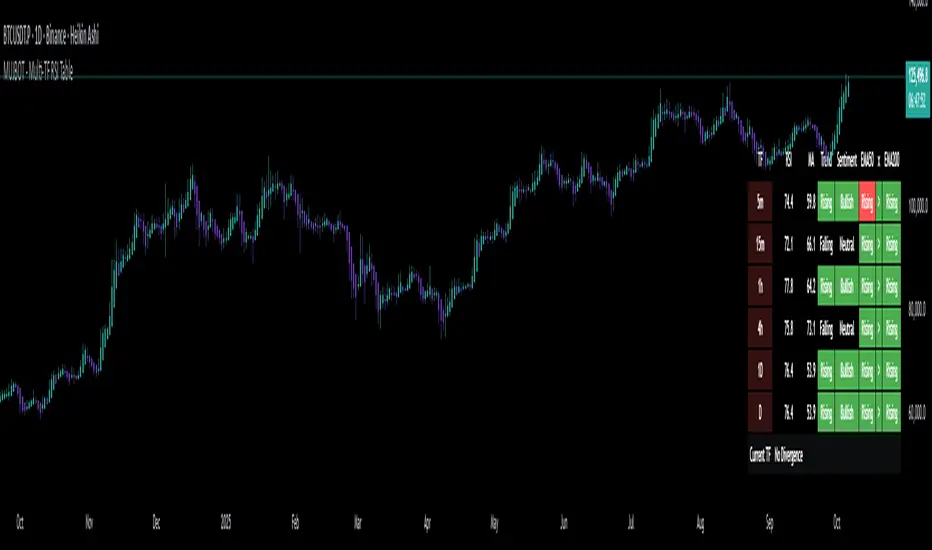
MUJBOT - Multi-TF RSI Table
The "Multi-TF RSI Table" indicator is a comprehensive tool designed to present traders with a quick visual summary of the Relative Strength Index (RSI) across multiple timeframes, all within a single glance. It is crafted for traders who incorporate multi-timeframe analysis into their trading strategy, aiming to enhance decision-making by identifying overall market sentiment and trend direction. Here's a rundown of its features:
User Inputs: The indicator includes customizable inputs for the RSI and Moving Average (MA) lengths, allowing users to tailor the calculations to their specific trading needs. Additionally, there is an option to display or hide the RSI & MA table as well as to position it in various places on the chart for optimal visibility.
Multi-Timeframe RSI & MA Calculations: It fetches RSI and MA values from different timeframes, such as 1 minute (1m), 5 minutes (5m), 15 minutes (15m), 1 hour (1h), 4 hours (4h), and 1 day (1D). This multi-timeframe approach provides a thorough perspective of the momentum and trend across different market phases.
Trend and Sentiment Analysis: For each timeframe, the script determines whether the average RSI is above or below the MA, categorizing the trend as "Rising", "Falling", or "Neutral". Moreover, it infers market sentiment as "Bullish" or "Bearish", based on the relationship between the RSI and its MA.
Dynamic Color-Coding: The indicator uses color-coding to convey information quickly. It highlights the trend and sentiment cells in the table with green for "Bullish" and red for "Bearish" conditions. It also shades the timeframe cells based on the RSI value, with varying intensities of green for "Oversold" conditions and red for "Overbought" conditions, providing an immediate visual cue of extreme market conditions.
Customization and Adaptability: The script is designed with customization in mind, enabling users to adjust the RSI and MA lengths according to their trading strategy. Its adaptable interface, which offers the option to display or hide the RSI & MA table, ensures that the tool fits into different trading setups without cluttering the chart.
Ease of Use: By consolidating critical information into a simple table, the "Multi-TF RSI Table" indicator saves time and simplifies the analysis process for traders. It eliminates the need to switch between multiple charts or timeframes, thus streamlining the trading workflow.
In essence, the "Multi-TF RSI Table" is a powerful indicator for Pine Script users on TradingView, offering a multi-dimensional view of market dynamics. It is ideal for both novice and experienced traders who seek to enhance their technical analysis with an at-a-glance summary of RSI trends and market sentiment across various timeframes.
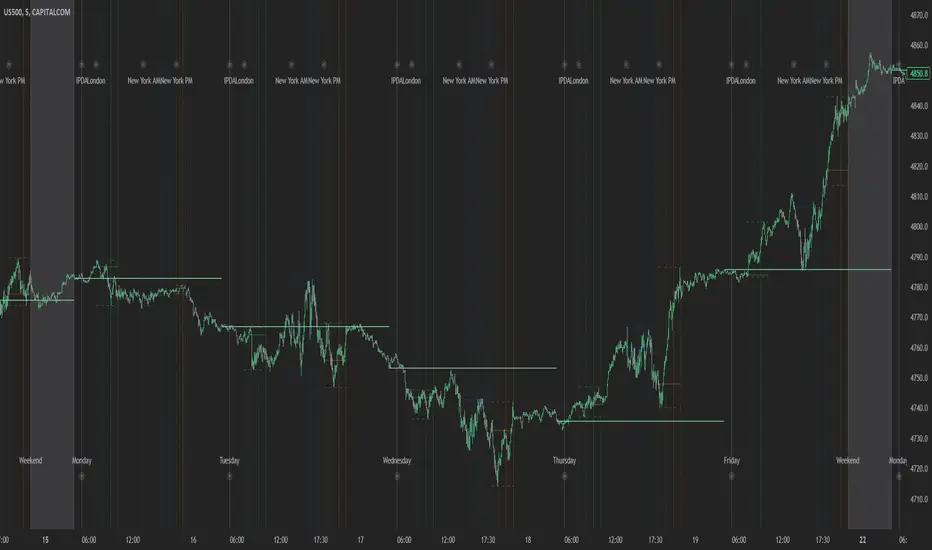
Index Kill Zones - SMC IndicatorsWhat are Index Kill Zones?
Index Kill Zones are specific Time Windows of opportunity during the Session for Indices that have the potential for the highest volatility and where looking for trading opportunities is ideal.
The Index Kill Zone Indicator is specifically designed for the SP500, NQ100, and DJ30, Markets. What differentiates this script from other Kill Zones scripts is that this script is based on NY Midnight as the basis for the start of the day.
This is not the usual below-average Index Kill Zone indicator because this indicator does not only show the 3 main Kill Zones or Sessions, but it also offers extra Kill Zones within each session that are called "AM Session", "PM Session", the "Launch Hour", the "Silver Bullet for the London, AM, and PM Sessions", and the "Last Hour" for the London, AM, and PM sessions.
Another key differentiator of this indicator's functionality is that it shows the highs and lows of each Kill zone allowing SMC traders to monitor Time-Based Liquidity above the highs and lows of each trading session.
By splitting each trading day into AM and PM Sessions, we can identify 3 types of potential daily profiles. These daily profiles could be used as conceptual templates as to what to expect from the price during a certain day. The 6 templates are the following:
1. Two Sessions Up: Where the price would go in one direction higher during both the AM and PM Sessions.
2. Two Sessions Down: Where the price would go in one direction lower during both the AM and PM Sessions.
3. AM Rally, then PM Decline: The price would go higher during the AM session and then lower during the PM Session.
4. AM Decline, then PM Rally: The price would go lower during the AM session and then higher during the PM Session.
5. Consolidation, AM Rally, then PM Decline: Where the price would consolidate most of the AM Session, then go higher into the last hour, and then reverse and go lower during the PM Session.
5. Consolidation, AM Decline, then PM Rally: Where the price would consolidate most of the AM Session, then go lower into the last hour, and then reverse and go higher during the PM Session.
Within each AM and PM Session, there is a "Silver Bullet" that acts as a time window of opportunity to get into a continuation trade in the direction of the prevailing trend.
Also, within each AM and PM Session, there is a "Last Hour" that acts as a time window of opportunity to get into a trade in the direction of the potential trend if the price has not moved yet, or as a reversal trade opportunity if the price has already ran previous short-term highs or lows.
Finally, we have also incorporated a Notification function to remind the trader of the start of the trading Kill Zones to not miss out on potential trade opportunities.
Key Functionalities
Universal Time Reference
Every day starts at 00:00 NY Midnight, irrespective of the trader's local time, Instead of the Standard GMT Midnight. This allows all Index Kill Zones to be in line with the New York start of the day at Midnight, as taught by ICT.
Weekend Highlighter
This feature highlights time from Sunday Market Open at 5 PM NY Time to 00:00 NY Midnight.
It's useful for identifying the non-trading or the low volatility periods when trading should be avoided.
Features Breakdown
Lookback Period
Defaulted to 60 trading days, aligning with “IPDA Data Ranges”, which is ideal for backtesting.
It's adjustable for trading, and it's recommended to keep it at 20 trading days to focus on the most recent data only.
24-hour Daily Intervals
The 24-hour intervals are not the same as the usual daily candle. Instead, the start of each trading day is anchored to the 00:00 NY Midnight.
Highlights "Days of the Week" labels, "Weekend" Trading Time, and the daily high-low ranges based on the start of trading day mark being at 00:00 NY Midnight.
London Kill Zones (Green)
The Full London Session starts from 02:00 NY Time to 05:00 NY Time.
London Silver Bullet starts from 03:00 NY Time to 04:00 NY Time.
London Last Hour starts from 04:00 NY Time to 05:00 NY Time.
Highlights the high and low of the London Kill Zone to Identify Time-Based Liquidity above and below the London Kill Zone Range.
AM Session Kill Zone (Blue)
The full AM Session Starts from 09:30 NY time to 12:00 NY Time.
AM Session Silver Bullet starts from 10:00 NY Time to 11:00 NY Time.
AM Session Last Hour starts from 11:00 NY Time to 12:00 NY Time.
Highlight the high and low of the AM Session to Identify Time-Based Liquidity above and below the AM Session Range.
Highlights the time when there is the highest volatility during the AM Session.
PM Session Kill Zone (Orange)
The full PM Session Starts from 13:00 NY time to 16:00 NY Time.
PM Session Silver Bullet starts from 14:00 NY Time to 15:00 NY Time.
PM Session Last Hour starts from 15:00 NY Time to 16:00 NY Time.
Highlight the high and low of the PM Session to Identify Time-Based Liquidity above and below the PM Session Range.
Highlights the time when there is the highest volatility during the PM Session.
Bonus Features
Daily & Weekly Open Price Levels
The Open Price levels draw a horizontal line from the start of the trading day at 00:00 NY midnight, and it extends it towards the end of the trading day.
This is useful for understanding where the price is relative to the daily candle.
When Bullish, the trader should look for setups at or below the daily or weekly open price.
When Bearish, the trader should look for setups at or above the daily or weekly open price.
Whether to choose the Daily or Weekly open price depends on the trader's trading style. If the trader is day trading or scaling, then it's more appropriate to choose the Daily Open Price.
However, Day Traders can also use the Weekly candle to align with the Weekly Candle's expected range direction.
On the other hand, if the trader is a Swing Trader and wants to capitalise on the weekly candle's trend, then it's more appropriate to choose the Weekly Open Price.
However, Swing Traders can also use the Daily Open Price when looking to take a trade to time better entries with a high risk-to-reward ratio.
Daily Open Price Level (in Green) and Weekly Open Price Level (in White)
Kill Zones Open Price Level
This is useful if the trader is an intra-session trader and wants to treat the sessions as the daily candle. In this case, the trader can use the Kill Zones Open Price levels based on the same logic of the Daily Open Price, where the trade would look for buy opportunities below the Session's open price and look for sell opportunities above the Session's Open Price Level.
Notifications
The trader can also receive alerts as a reminder at the start of the desired session to ensure that he or she does not miss the start of the trading session.
Blockunity Excess Index (BEI)Identify excess zones resulting in market reversals by visualizing price deviations from an average.
The Excess Index (BEI) is designed to identify excess zones resulting in reversals, based on price deviations from a moving average. This moving average is fully customizable (type, period to be taken into account, etc.). This indicator also multiplies the moving average with a configurable coefficient, to give dynamic support and resistance levels. Finally, the BEI also provides reversal signals to alert you to any risk of trend change, on any asset.
The Idea
The goal is to provide the community with a visual and customizable tool for analyzing large price deviations from an average.
How to Use
Very simple to use, this indicator plots colored zones according to the price's deviation from the moving average. Moving average extensions also provide dynamic support and resistance. Finally, signals alert you to potential reversal points.
Elements
The Moving Average
The Moving Average, which defaults to a gray line over 200 periods, serves as a stable reference point. It is accompanied by an Index, whose color varies from yellow to orange to red, offering an overview of market conditions.
Extensions
These dynamic lines can be used to determine effective supports and resistances.
Signals
Green and red triangles serve as clear indicators for buy and sell signals.
Settings
Mainly, the type of moving average is configurable. The default is an SMA.
A Simple Moving Average (SMA) calculates the average of a selected range of prices by the number of periods in that range.
But you can also, for example, switch the mode to EMA.
The Exponential Moving Average (EMA) is a moving average that places a greater weight and significance on the most recent data points:
You also have WMA.
A Weighted Moving Average (WMA) gives more weight on recent data and less on past data:
And finally, the possibility of having a PCMA.
PCMA takes into account the highest and lowest points in the lookback period and divides this by two to obtain an average:
You can change other parameters such as lookback periods, as well as the coefficient used to define extension lines.
You can refer to the tooltips directly in the indicator parameters.
For those who prefer a minimalist display, you can activate a "Bar Color" in the settings (You must also uncheck "Borders" and "Wick" in your Chart Settings), and deactivate all other elements as you wish:
Finally, you can customize all the different colors, as well as the parameters of the table that indicates the Index value and the asset trend.
How it Works
The Index is calculated using the following method:
abs_distance = math.abs(close - base_ma)
bei = (abs_distance - ta.lowest(abs_distance, lookback_norm)) / (ta.highest(abs_distance, lookback_norm) - ta.lowest(abs_distance, lookback_norm)) * 100
Signals are triggered according to the following conditions:
A Long (buy) signal is triggered when the Index falls below 100, when the closing price is lower than 5 periods ago, and when the price is under the moving average.
A Short (sell) signal is triggered when the Index falls below 100, when the closing price is greater than 5 periods ago, and when the price is above the moving average.

Amazing Oscillator (AO) [Algoalpha]Description:
Introducing the Amazing Oscillator indicator by Algoalpha, a versatile tool designed to help traders identify potential trend shifts and market turning points. This indicator combines the power of the Awesome Oscillator (AO) and the Relative Strength Index (RSI) to create a new indicator that provides valuable insights into market momentum and potential trade opportunities.
Key Features:
Customizable Parameters: The indicator allows you to customize the period of the RSI calculations to fine-tune the indicator's responsiveness.
Visual Clarity: The indicator uses user-defined colors to visually represent upward and downward movements. You can select your preferred colors for both bullish and bearish signals, making it easy to spot potential trade setups.
AO and RSI Integration: The script combines the AO and RSI indicators to provide a comprehensive view of market conditions. The RSI is applied to the AO, which results in a standardized as well as a less noisy version of the Awesome Oscillator. This makes the indicator capable of pointing out overbought or oversold conditions as well as giving fewer false signals
Signal Plots: The indicator plots key levels on the chart, including the RSI threshold(Shifted down by 50) at 30 and -30. These levels are often used by traders to identify potential trend reversal points.
Signal Alerts: For added convenience, the indicator includes "x" markers to signal potential buy (green "x") and sell (red "x") opportunities based on RSI crossovers with the -30 and 30 levels. These alerts can help traders quickly identify potential entry and exit points.

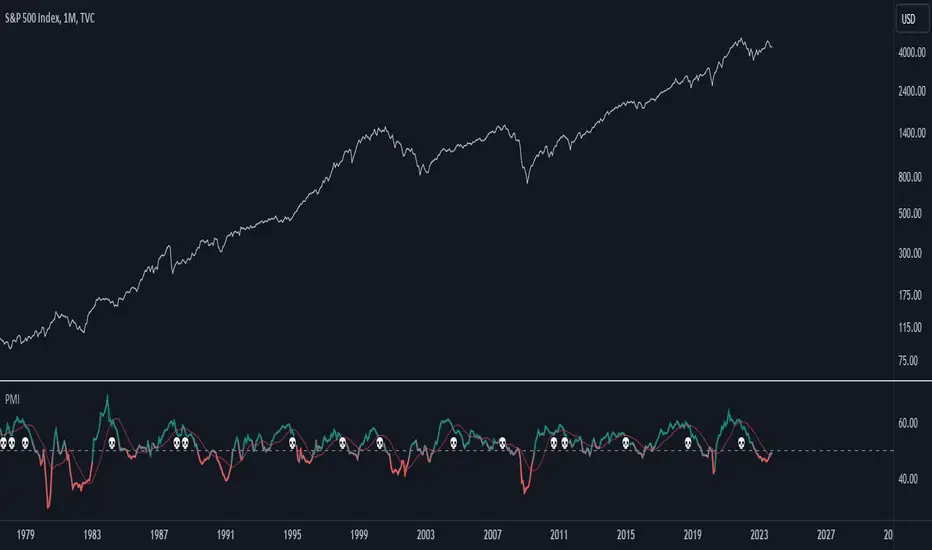
Purchasing Managers Index (PMI)The Purchasing Managers Index (PMI) is a widely recognized economic indicator that provides crucial insights into the health and performance of an economy's manufacturing and services sectors. This index is a vital tool for anticipating economic developments and trends, offering an early warning system for changes in these sectors.
The PMI is calculated based on surveys conducted among purchasing managers in various businesses and organizations. These managers are asked about their perceptions of current business conditions and their expectations for future economic activity within their sectors. The responses are then compiled and used to calculate the PMI value.
A PMI value above 50 typically indicates that the manufacturing or services sector is expanding, suggesting a positive economic outlook. Conversely, a PMI value below 50 suggests contraction, which may be an early indication of economic challenges or a potential recession.
In summary, the Purchasing Managers Index (PMI) is an essential economic indicator that assesses the health of manufacturing and services sectors by surveying purchasing managers' opinions. It serves as an early warning system for changes in economic activity and is a valuable tool for forecasting economic trends and potential crises.
This code combines the Purchasing Managers Index (PMI) data with two Simple Moving Averages (SMA) and some visual elements.
Let's break down how this indicator works:
1. Loading PMI Data:
The indicator loads data for the "USBCOI" symbol, which represents the PMI data. It fetches the monthly closing prices of this symbol.
2. Calculating Moving Averages:
Two Simple Moving Averages (SMAs) are calculated based on the PMI data. The first SMA, sma_usbcoi, has a length defined by the input parameter (default: 2). The second SMA, sma2_usbcoi, has a different length defined by the second input parameter (default: 14).
3. Color Coding and Thresholds:
The line color of the PMI plot is determined based on the value of the PMI. If the PMI is above 52, the color is teal; if it's below 48, the color is red; otherwise, it's gray. These threshold values are often used to identify specific conditions in the PMI data.
4. Crossing Indicator:
A key feature of this indicator is to determine if the PMI crosses the first SMA (sma_usbcoi) from top to bottom while also being above the value of 52. This is indicated by the crossedUp variable. This condition suggests a specific situation where the PMI crosses a short-term moving average while indicating strength (above 52).
5. Visual Elements:
A "💀" skull emoji is defined as skullEmoji.
The PMI is plotted on the chart with color coding based on its value, as described earlier.
The two SMAs are also plotted on the chart.
When the crossedUp condition is met (PMI crosses the first SMA from top to bottom while above 52), a skull emoji (indicating potential danger) is plotted at the top of the indicator window.
YinYang Fear and Greed Index (FGI)Overview:
YinYang Fear and Greed Index is used for seeing how people are feeling towards the current price. It works similar to an RSI, but fluctuates differently. Essentially you want to be Greedy when the Index displays Fear and Fearful when it displays Greed. Our Indicator displays a Green Circle (Greed Signal) on the YinYang Fear and Greed Index when there is a large amount of Greed at this price point. It displays a Red Circle (Fear Signal) when there is a large amount of Fear. The Fear and Greed Signals can happen at any Fear and Greed Index but generally they correlate with the Index level. The Fear and Greed Signals are much more important at dictating a swing in momentum than the actual Index itself. The Index is more of a guide and is useful for seeing when the Index level crosses the Ma (the yellow line) as you can see a shift in momentum. However for large swings in momentum, the Fear and Greed Signals should be used. Do NOT Ignore these signals, they are quite powerful at predicting momentum swings.
Tutorial:
As you can see, the Fear and Greed Index looks somewhat similar to an RSI, but it has the ability to gain drastic momentum when there are strong changes in Fear and Greed.
When it comes to identifying buy/sell locations you generally want to ensure 2 things:
For a buy, the Fear and Greed Index (FGI) is less than 30.
For a sell, the FGI is greater than 70.
A signal has occurred. For buy that is the red circle and for sell that is the green circle.
The reason we generally want to ensure these 2 rules is to ensure you have the highest chance of being right with the lowest risk of being wrong. The way you want to use this indicator is; Be Fearful when others are Greedy and Greedy when others are Fearful.
There will be times when a fear or greed signal appears when the index is between 30-70. When these occur, they are still generally strong signal locations that represent a high chance of momentum in the direction they signal, however they face a higher risk of being wrong and therefore shouldn’t be used on its own to make a trade.
In the photo above we can see that the FGI’s color changed from Red to Orange in the candle after the Fear Signal. This happened because there was high price movement right after it (which is normal) and caused the Fear level to drop.
The color the FGI displays is based not off the FGI but by the STATE it is currently in. When the color is Green it is in a state of HIGH GREED, when the color is Red it is in a state of HIGH FEAR. When the color is Teal it is in a state of SLIGHT GREED, when the color is Orange it is in a state of SLIGHT FEAR. These colors hold true for the Information Tables as well.
As we can also see from the example above, it is 100% possible to have a state of HIGH GREED when the FGI is low. For instance look at the Fear (BUY) signals circled. Right before the Fear Signals happened, it was in a state of HIGH GREED (Green). The opposite is also true with Fear. We can have a high state of Fear when the FGI is high. However, please do remember, the lowest risk and best time to make trades is still:
FGI is higher than 70 and there is a Greed Signal = SELL
FGI is lower than 30 and there is a Fear Signal = BUY
You may notice there are sometimes occurrences that we call ‘Oddballs’. These oddballs are quite rare but they do happen and when they do they’re generally in clusters (close together). These Oddballs are when a Greed Signal occurs when the FGI is very low or when a Fear Signal occurs when the FGI is very high. Basically, they are occurring in the opposite location that they are supposed to. These may not seem like they matter but they matter a lot. As you can see based on where the blue vertical lines are, the price moved in the direction the signal identified shortly after the signal.
You may be wondering, are Oddball’s stronger price influencers than the regular signal? The issue with Oddballs is they sometimes CAN BE. But generally they aren’t. They generally do signal price movement will occur in the direction they are influencing, but generally not as much movement as if it occurred properly (Fear signal under 30 or Greed signal above 70).
The takeaway from Oddballs is to acknowledge their existence and potentially use them as markers for smaller purchases or DCA locations. We don’t recommend treating them as a legitimate purchase signal as they generally are weaker and less predictable, but nevertheless don’t dismiss them.
Our Information Tables are there to show you the FGI on 6 different Time Frames at the same time. This can be very useful for knowing how the other Time Frames are fairing while you are trading without needing to constantly change the Time Frame you are on.
For example, you see a Fear Signal on the 1 Day Time Frame, you then swap to the 15 minute Time Frame to find your entry location. Well, once you’re locked into that trade, you’ll likely be fixated on the 15 minute Time Frame. There’s a chance while you’re still waiting for your exit that levels and states of the FGI could change on higher Time Frames. This could drastically influence when and where your exit on the lower Time Frame should be.
This concludes our Tutorial on how to use YinYang Fear and Greed Index (FGI). However, continue reading for a description and better understanding of the Settings available to you for customization within this Indicator.
Settings:
1. Information Tables:
1.1. Show Information Tables:
Our Information Tables display 6 different Time Frames (resolutions) so that you can see the current level of Fear and Greed (FGI) that is prevalent on each Time Frame. There are 4 different states the FGI can be in:
Fear (Red)
Minor Fear (Orange)
Greed (Green)
Minor Greed (Teal)
The color of each Time Frame Cell (on Oscillator and in the table) is based on the following:
Red: Red represents that it is currently in a state of Fear. When it is in a state of fear it means traders are being overly bearish and selling when they likely shouldn’t. While it is in a state of Fear, there is a high chance of BULLISH price movement occurring. Remember, Be Fearful when others are Greedy and Greedy when others are Fearful.
Orange: Orange represents that it is currently in a state of Minor Fear. Minor Fear means that the FGI is less than 50, but it’s not currently in a state of Fear or Greed. While it is in this state, there is a better chance for BULLISH price action than there is bearish but it's nowhere near as likely as when in a state of Fear.
Green: Green represents that it is currently in a state of Greed. When it is in a state of Greed, it means traders are being overly bullish and buying when they shouldn’t. While it is in a state of Greed, there is a high chance of BEARISH price movement occurring.
Teal: Teal represents that it is currently in a state of Minor Greed. Minor Greed means that the FGI is greater than 50, but it’s not currently in a state of Fear or Greed. While it is in this state, there is a better chance for BEARISH price actions than there is bullish; but it’s nowhere near as likely as when its in a state of Greed.
2. Res1 / Res2/ Res3 / Res4 / Res5 / Res6:
These represent the different resolutions (Time Frames) being used in your information tables and can be modified to display whatever resolution works best for your trading style. By default they are:
Res1: Current Timeframe
Res2: 15 Minute
Res3: 1 Hour
Res4: 4 Hour
Res5: 1 Day
Res6: 1 Week
Backup Res (not changeable): 5 Minute (this is only used if your Current Timeframe in Res1 is a duplicate of one of the other resolutions)
Our Fear and Greed Index can be very useful for understanding how people are feeling in the market and when large price swings will occur. Remember, Be Greedy when others are Fearful and Fearful when others are Greedy!
If you have any Questions or Concerns, don’t hesitate to contact us.
HAPPY TRADING!

Bollinger RSI BandsIndicator Description:
The "Bollinger RSI Bands" is an advanced technical analysis tool designed to empower traders with comprehensive insights into market trends, reversals, and overbought/oversold conditions. This multifaceted indicator combines the unique features of candle coloration and Bollinger Bands with the Relative Strength Index (RSI), making it an indispensable tool for traders seeking to optimize their trading strategies.
Purpose:
The primary purpose of the "Bollinger RSI Bands" indicator is to provide traders with a holistic view of market dynamics by offering the following key functionalities:
Candle Coloration: The indicator's signature candle colors - green for bullish and red for bearish - serve as a visual representation of the prevailing market trend, enabling traders to quickly identify and confirm market direction.
RSI-Based Moving Average: A smoothed RSI-based moving average is plotted, facilitating the detection of trend changes and potential reversal points with greater clarity.
RSI Bands: Upper and lower RSI bands, set at 70 and 30, respectively, help traders pinpoint overbought and oversold conditions, aiding in timely entry and exit decisions.
Bollinger Bands: In addition to RSI bands, Bollinger Bands are overlaid on the RSI-based moving average, offering insights into price volatility and highlighting potential breakout opportunities.
How to Use:
To maximize the utility of the "Bollinger RSI Bands" indicator, traders can follow these essential steps:
Candle Color Confirmation: Assess the color of the candles. Green candles signify a bullish trend, while red candles indicate a bearish trend, providing a clear and intuitive visual confirmation of market direction.
Overbought and Oversold Identification: Monitor price levels relative to the upper RSI band (70) for potential overbought signals and below the lower RSI band (30) for potential oversold signals, allowing for timely adjustments to trading positions.
Trend Reversal Recognition: Observe changes in the direction of the RSI-based moving average. A transition from bearish to bullish, or vice versa, can serve as a valuable signal for potential trend reversals.
Volatility and Breakout Opportunities: Keep a watchful eye on the Bollinger Bands. Expanding bands signify increased price volatility, often signaling forthcoming breakout opportunities.
Why Use It:
The "Bollinger RSI Bands" indicator offers traders several compelling reasons to incorporate it into their trading strategies:
Clear Trend Confirmation: The indicator's distinct candle colors provide traders with immediate confirmation of the current trend direction, simplifying trend-following strategies.
Precise Entry and Exit Points: By identifying overbought and oversold conditions, traders can make more precise entries and exits, optimizing their risk-reward ratios.
Timely Trend Reversal Signals: Recognizing shifts in the RSI-based moving average direction allows traders to anticipate potential trend reversals and adapt their strategies accordingly.
Volatility Insights: Bollinger Bands offer valuable insights into price volatility, aiding in the identification of potential breakout opportunities.
User-Friendly and Versatile: Despite its advanced features, the indicator remains user-friendly and versatile, catering to traders of all experience levels.
In summary, the "Bollinger RSI Bands" indicator is an indispensable tool for traders seeking a comprehensive view of market dynamics. With its unique combination of candle coloration and Bollinger Bands, it empowers traders to make more informed and strategic trading decisions, ultimately enhancing their trading outcomes.
Note: Always utilize this indicator in conjunction with other technical and fundamental analysis tools and exercise prudence in your trading decisions. Past performance is not indicative of future results.

Laguerre RSI - non repaintingIt seems that the traditional Laguerre* functions repaint due to the gamma parameter.
That goes even for the editorial pick here.
But one could use calculation period instead of "gamma" parameter. This gives us a non-repainting Laguerre RSI fit for scalping trends.
At first glance, I haven't seen anyone do this with a pine script, but I could be wrong because it's not a big deal.
So here is a variation of Laguerre RSI, without repainting. It's a little bit more insensitive, but this is not of great importance, since only the extreme values are used for confirmation.
( * Laguerre RSI is based on John EHLERS' Laguerre Filter to avoid the noise of RSI.)
And if you implement this indicator into a strategy (like I do) I can give you a trick.
Traditionaly the condition is at follows:
LaRSI = cd == 0 ? 100 : cu / (cu + cd)
(this is the final part of the indicator before the plotting)
LongLaguerre= LaRSIupb
It's fine for the short (ot exit long), but for the long is better to make a swich between the CD and CU parameters, as follows:
LaRSI1 = cd == 0 ? 100 : cu / (cu + cd)
LaRSI2 = cu == 0 ? 100 : cu / (cu + cd)
LongLaguerre= LaRSI2upb
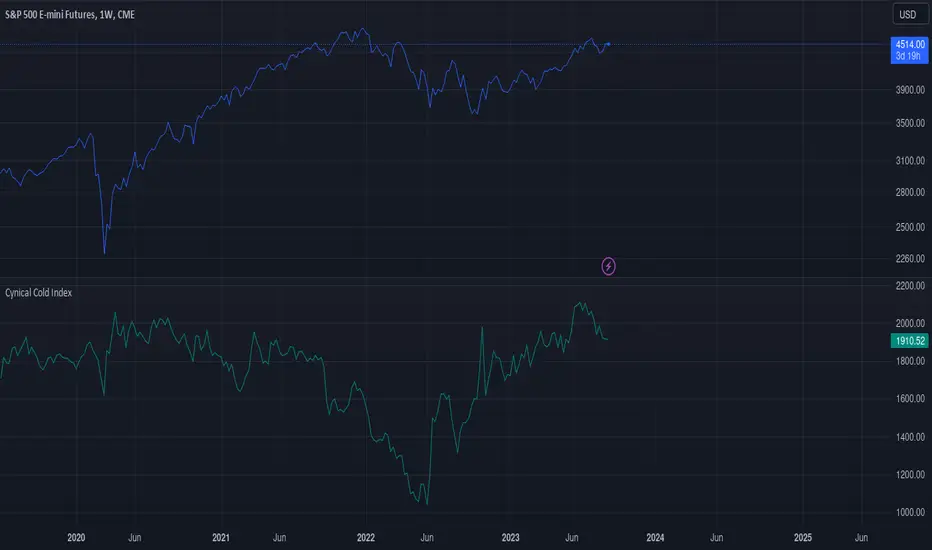
Cynical Cold IndexThis TradingView indicator calculates the Cynical Cold Index, which is a weighted basket of commodity prices designed to track economic conditions. It compares the price of a given asset to the index value.
Weights the commodities as percentages:
Gold: 10%
Oil: 15%
Coffee: 5%
Natural Gas: 10%
Silver: 15%
Sugar: 5%
Corn: 5%
Wheat: 5%
Cotton: 10%
Copper: 10%
Iron Ore: 5%
Live Cattle: 5%
Urea: 5%
Zaree - FX Index RSI IndicatorDescription:
The "Zaree - FX Index RSI Indicator" (FIRI) is a technical analysis tool designed to provide insights into the relative strength of two selected currency indices using the Relative Strength Index (RSI). It allows traders to compare the RSI values of a primary currency index and a secondary currency index, helping them identify potential overbought and oversold conditions in the currency market.
Details of the Indicator:
The indicator calculates the RSI for both the primary and secondary currency indices based on the user's selections.
Traders can choose from a variety of currency indices to use as the primary and secondary indices for comparison.
The indicator offers settings for customizing the calculation of the RSI, including selecting the type of moving average (SMA, EMA, WMA, SMMA) and adjusting the length of the RSI and moving average.
Upper and lower RSI bands are displayed on the chart to highlight potential overbought and oversold conditions.
The RSI values and their corresponding moving average values are plotted on the chart, allowing traders to visually analyze the relative strength of the indices.
How to Use the Indicator:
Select the primary and secondary currency indices you want to compare from the provided dropdown menus. These indices will serve as the basis for RSI calculation.
Choose the type of moving average (SMA, EMA, WMA, SMMA) to use for RSI calculation and set the desired length for the moving average.
Decide whether you want to visualize the RSI and moving average values for the primary and secondary indices on the chart.
Observe the RSI values and moving averages plotted on the chart. The indicator's upper and lower bands can help you identify potential overbought (above the upper band) and oversold (below the lower band) conditions.
Pay attention to the intersections between the RSI values and the moving average lines. These intersections can provide insights into potential trend changes or reversals in the currency market.
Example of Usage:
Let's say you're a swing trader focusing on currency pairs involving the US Dollar (USD) and Euro (EUR). You want to compare the relative strength of the USD Index (USDINX) and the EUR Index (EURINX) to identify potential trading opportunities. Here's how you can use the FIRI indicator:
Select "USDINX" as the primary index and "EURINX" as the secondary index.
Choose "SMA" as the moving average type and set the RSI length to 14.
Enable the visualization of RSI values for both the primary and secondary indices.
Observe the chart to identify instances where the RSI values of the indices cross above the upper band (potential overbought) or below the lower band (potential oversold).
Look for intersections between the RSI values and the moving average lines. A bullish signal may occur when the RSI crosses above the moving average, indicating potential upward momentum, while a bearish signal may occur when the RSI crosses below the moving average, indicating potential downward momentum.
Remember that the FIRI indicator is a tool to assist you in your analysis. It's important to consider other technical and fundamental factors before making trading decisions.
Feel free to adjust the settings of the indicator based on your trading preferences and strategy. Keep in mind that no indicator is foolproof, and it's recommended to use the FIRI indicator in conjunction with other analysis techniques for a comprehensive trading approach.

Zaree - FX Index Spread IndicatorDescription:
The "Zaree - FX Index Spread Indicator" (FISI) is a powerful technical analysis tool designed to provide insights into the spread between two selected currency indices. By calculating and visualizing the percentage difference between the values of a primary and a secondary currency index, traders can gain valuable information about potential market dynamics and trends.
Details of the Indicator:
The indicator calculates the spread percentage between a primary and a secondary currency index, allowing traders to understand the relative strength of the two indices.
Traders can choose from a list of currency indices to use as the primary and secondary indices for comparison.
The indicator offers multiple methods for setting thresholds to identify potential trading opportunities, including standard deviations, percentile ranks, historical highs and lows, and fixed thresholds.
Users can customize the length of the calculation period and choose whether to display the primary index, secondary index, and the spread percentage on the chart.
Shaded areas on the chart indicate regions where the spread percentage is above or below predefined thresholds, helping traders identify potential trading signals.
How to Use the Indicator:
Select the primary and secondary currency indices you want to compare from the provided dropdown menus. These indices will be used to calculate the spread percentage.
Choose the method for setting thresholds by selecting one of the options: "Standard Deviations," "Percentile Ranks," "Historical Highs and Lows," or "Fixed Thresholds."
Depending on the selected method, configure the relevant threshold parameters, such as historical threshold percentage, upper and lower fixed thresholds, upper and lower percentile thresholds, or the standard deviation multiplier.
Choose whether to visualize the primary index, secondary index, and spread percentage on the chart by enabling the respective options.
Observe the chart to identify potential trading signals based on the interactions between the spread percentage and the predefined thresholds.
Example of Usage:
Suppose you're interested in trading currency pairs involving the US Dollar (USD) and Euro (EUR), and you want to monitor the spread between the USD Index (USDINX) and the EUR Index (EURINX). Here's how you can use the FISI indicator:
Select "USDINX" as the primary index and "EURINX" as the secondary index.
Choose the method for setting thresholds based on your strategy. For instance, you can select "Standard Deviations" and adjust the standard deviation multiplier.
Enable the visualization of the primary index, secondary index, and spread percentage on the chart.
Observe the shaded areas on the chart. If the spread percentage crosses above the upper threshold, it may indicate a potential market overextension. Conversely, if the spread percentage crosses below the lower threshold, it could suggest an oversold market condition.
Look for instances where the spread percentage approaches or crosses the predefined thresholds. Consider these instances as potential entry or exit points for your trades.
Remember that the FISI indicator is a tool to assist you in your analysis. It's recommended to combine its insights with other technical and fundamental factors before making trading decisions. Adjust the indicator settings and thresholds based on your trading strategy and preferences.
As with any trading tool, practice and observation are key. Over time, you can refine your trading strategy by analyzing historical data and observing how the indicator performs in different market conditions.
Feel free to experiment with different settings and methods to find the configuration that aligns best with your trading style and goals.
Ultimate RSI [LuxAlgo]The Ultimate RSI indicator is a new oscillator based on the calculation of the Relative Strength Index that aims to put more emphasis on the trend, thus having a less noisy output. Opposite to the regular RSI, this oscillator is designed for a trend trading approach instead of a contrarian one.
🔶 USAGE
While returning the same information as a regular RSI, the Ultimate RSI puts more emphasis on trends, and as such can reach overbought/oversold levels faster as well as staying longer within these areas. This can avoid the common issue of an RSI regularly crossing an overbought or oversold level while the trend makes new higher highs/lower lows.
The Ultimate RSI crossing above the overbought level can be indicative of a strong uptrend (highlighted as a green area), while an Ultimate RSI crossing under the oversold level can be indicative of a strong downtrend (highlighted as a red area).
The Ultimate RSI crossing the 50 midline can also indicate trends, with the oscillator being above indicating an uptrend, else a downtrend. Unlike a regular RSI, the Ultimate RSI will cross the midline level less often, thus generating fewer whipsaw signals.
For even more timely indications users can observe the Ultimate RSI relative to its signal line. An Ultimate RSI above its signal line can indicate it is increasing, while the opposite would indicate it is decreasing.
🔹 Smoothing Methods
Users can return more reactive or smoother results depending on the selected smoothing method used for the calculation of the Ultimate RSI. Options include:
Exponential Moving Average (EMA)
Simple Moving Average (SMA)
Wilder's Moving Average (RMA)
Triangular Moving Average (TMA)
These are ranked by the degree of reactivity of each method, with higher ones being more reactive (but less smooth).
Users can also select the smoothing method used by the signal line.
🔶 DETAILS
The RSI returns a normalized exponential average of price changes in the range (0, 100), which can be simply calculated as follows:
ema(d) / ema(|d|) × 50 + 50
where d represent the price changes. In order to put more emphasis on trends we can put higher weight on d . We can perform this on the occurrence of new higher highs/lower lows, and by replacing d with the rolling range instead (the rolling period used to detect the higher highs/lower lows is equal to the length setting).
🔶 SETTINGS
Length: Calculation period of the indicator
Method: Smoothing method used for the calculation of the indicator.
Source: Input source of the indicator
🔹 Signal Line
Smooth: Degree of smoothness of the signal line
Method: Smoothing method used to calculation the signal line.

Enhanced Smoothed RSIThe "Enhanced Smoothed RSI Factor" indicator is a robust technical analysis tool designed to assist traders in identifying potential trends and reversals. This indicator combines elements of the Relative Strength Index (RSI) with a smoothed factor, enhancing its reliability and responsiveness. By visualizing the Enhanced Smoothed RSI Factor alongside the standard RSI and their associated upper and lower bands, traders gain insights into potential overbought and oversold conditions, facilitating more informed trading decisions.
How to Use:
Inputs Configuration : Adjust the indicator's parameters according to your trading preferences. Modify the source data (source) to suit the price data you want to analyze. Set the RSI period (rsiPeriod) for RSI calculations, the moving average period (movingAvgPeriod) for the bands, and the smoothing factor (factor) for enhanced responsiveness.
Enhanced Smoothed RSI Factor : The indicator calculates the Enhanced Smoothed RSI Factor by applying an exponential moving average (EMA) to the RSI values. This factor reflects changes in price momentum.
Comparison with Standard RSI : Observe the Enhanced Smoothed RSI Factor and the standard RSI side by side on your chart. While the standard RSI offers insights into price momentum, the Enhanced Smoothed RSI Factor adds an extra layer of smoothing for potentially clearer trend indications.
Bands and Bar Coloring : The indicator plots upper and lower bands, which are derived from weighted and simple moving averages of the Enhanced Smoothed RSI Factor. The color of the bars changes based on the position of the Enhanced Smoothed RSI Factor relative to the bands. Green bars indicate values above the upper band, red bars indicate values below the lower band, and gray bars indicate values within the bands.
Overbought and Oversold Levels : The indicator provides horizontal lines at levels 140 and 80. When the Enhanced Smoothed RSI Factor crosses above 140, it suggests a potential bullish trend, while crossing below 80 suggests a potential bearish trend. Additionally, levels 200 and 180 indicate overbought conditions, and levels 100 and 80 indicate oversold conditions.
Additional Insights : The indicator's upper and lower bands provide valuable insights into potential trend reversals. When the Enhanced Smoothed RSI Factor crosses above the upper band, it may signal an overextended bullish trend. Conversely, a crossover below the lower band may indicate an overextended bearish trend.
Important Considerations :
This indicator is most effective when used in conjunction with other technical analysis tools and strategies.
It's recommended to avoid making trading decisions solely based on the Enhanced Smoothed RSI Factor. Combine it with other indicators, chart patterns, and fundamental analysis.
Adjust the overbought and oversold levels to align with your trading strategy and the specific market conditions.
Please remember that trading involves risks, and the indicator's signals are not guaranteed. Always conduct thorough research and consider using a practice account before implementing any trading strategy.

Advanced Volatility-Adjusted Momentum IndexAdvanced Volatility-Adjusted Momentum Index (AVAMI)
The AVAMI is a powerful and versatile trading index which enhances the traditional momentum readings by introducing a volatility adjustment. This results in a more nuanced interpretation of market momentum, considering not only the rate of price changes but also the inherent volatility of the asset.
Settings and Parameters:
Momentum Length: This parameter sets the number of periods used to calculate the momentum, which is essentially the rate of change of the asset's price. A shorter length value means the momentum calculation will be more sensitive to recent price changes. Conversely, a longer length will yield a smoother and more stabilized momentum value, thereby reducing the impact of short-term price fluctuations.
Volatility Length: This parameter is responsible for determining the number of periods to be considered in the calculation of standard deviation of returns, which acts as the volatility measure. A shorter length will result in a more reactive volatility measure, while a longer length will produce a more stable, but less sensitive measure of volatility.
Smoothing Length: This parameter sets the number of periods used to apply a moving average smoothing to the AVAMI and its signal line. The purpose of this is to minimize the impact of volatile periods and to make the indicator's lines smoother and easier to interpret.
Lookback Period for Scaling: This is the number of periods used when rescaling the AVAMI values. The rescaling process is necessary to ensure that the AVAMI values remain within a consistent and interpretable range over time.
Overbought and Oversold Levels: These levels are thresholds at which the asset is considered overbought (potentially overvalued) or oversold (potentially undervalued), respectively. For instance, if the AVAMI exceeds the overbought level, traders may consider it as a possible selling opportunity, anticipating a price correction. Conversely, if the AVAMI falls below the oversold level, it could be seen as a buying opportunity, with the expectation of a price bounce.
Mid Level: This level represents the middle ground between the overbought and oversold levels. Crossing the mid-level line from below can be perceived as an increasing bullish momentum, and vice versa.
Show Divergences and Hidden Divergences: These checkboxes give traders the option to display regular and hidden divergences between the AVAMI and the asset's price. Divergences are crucial market structures that often signal potential price reversals.
Index Logic:
The AVAMI index begins with the calculation of a simple rate of change momentum indicator. This raw momentum is then adjusted by the standard deviation of log returns, which acts as a measure of market volatility. This adjustment process ensures that the resulting momentum index encapsulates not only the speed of price changes but also the market's volatility context.
The raw AVAMI is then smoothed using a moving average, and a signal line is generated as an exponential moving average (EMA) of this smoothed AVAMI. This signal line serves as a trigger for potential trading signals when crossed by the AVAMI.
The script also includes an algorithm to identify 'fractals', which are distinct price patterns that often act as potential market reversal points. These fractals are utilized to spot both regular and hidden divergences between the asset's price and the AVAMI.
Application and Strategy Concepts:
The AVAMI is a versatile tool that can be integrated into various trading strategies. Traders can utilize the overbought and oversold levels to identify potential reversal points. The AVAMI crossing the mid-level line can signify a change in market momentum. Additionally, the identification of regular and hidden divergences can serve as potential trading signals:
Regular Divergence: This happens when the asset's price records a new high/low, but the AVAMI fails to follow suit, suggesting a possible trend reversal. For instance, if the asset's price forms a higher high but the AVAMI forms a lower high, it's a regular bearish divergence, indicating potential price downturn.
Hidden Divergence: This is observed when the price forms a lower high/higher low, but the AVAMI forms a higher high/lower low, suggesting the continuation of the prevailing trend. For example, if the price forms a lower low during a downtrend, but the AVAMI forms a higher low, it's a hidden bullish divergence, signaling the potential continuation of the downtrend.
As with any trading tool, the AVAMI should not be used in isolation but in conjunction with other technical analysis tools and within the context of a well-defined trading plan.

Intraday Intensity ModesIntraday Intensity Index was created by David Bostian and its use was later featured by John Bollinger in his book "Bollinger on Bollinger Bands" . It is categorically a volume indicator and considered to be a useful tool for analyzing supply and demand dynamics in the market. By measuring the level of buying and selling pressure within a given trading session it attempts to provide insights into the strength of market participants' interest and their aggressiveness in executing trades throughout the day. It can be used in conjunction with Bollinger Bands® or other envelope type indicators as a complimentary indicator to aid in trying to identify potential turning points or trends.
Intraday intensity is calculated based upon the relationship between the price change and the volume of shares traded during each daily interval. It aims to capture the level of buying or selling activity relative to the overall volume. A high intraday intensity value suggests a higher level of buying or selling pressure, indicating a more active and potentially volatile market. Conversely, a low intraday intensity value indicates less pronounced trading activity and a potentially quieter market. Overall, intraday intensity provides a concise description of the intensity of trading activity during a particular trading session, giving traders an additional perspective on market dynamics. Note that because the calculation uses volume this indicator will only work on symbols where volume is available.
While there are pre-existing versions within community scripts, none were found to have applied the calculations necessary for the various modes that are presented within this version, which are believed to be operating in the manner originally intended when first described by Bostian and again later by Bollinger. When operating in default modes on daily or lower chart timeframes the logic used within this script tracks the intraday high, low, close and volume for the day with each progressing intraday bar.
The BB indicator was included on the top main chart to help illustrate example usage as described below. The Intraday Intensity Modes indicator is pictured operating in three different modes beneath the main chart:
• The top pane beneath the main chart shows the indicator operating as a normalized 21 day II% oscillator. A potential use while in this mode would be to look for positive values as potential confirmation of strength when price tags the upper or lower Bollinger bands, and to look for negative values as potential confirmation of weakness when price tags the upper or lower Bollinger bands.
• The middle pane shows the indicator operating as an "open ended" cumulative sum of II. A potential use while in this mode would be to look for convergence or divergence of trend when price is making new highs or lows, or while price is walking the upper or lower Bollinger bands.
• The bottom pane shows the indicator operating in standard III mode, which provides independent values per session.
Indicator Settings: Inputs tab:
Osc Length : Set to 1 disables oscillation, values greater than 1 enables oscillation for II% (Intraday Intensity percent) mode.
Tootip : Hover mouse over (i) to show recommended example Settings for various modes.
Cumulative : When enabled values are cumulatively summed for the entire chart and indicator operates in II mode.
Normalized : When enabled a rolling window of Osc Length values are summed and normalized to the rolling window's volume.
Intrabar : When enabled price range and volume are evaluated for intensity per bar instead of per day which is a departure from the original
concept. Whenever this setting is enabled the indicator should be regarded as operating in an experimental mode.
Colors For Up Down : Sets the plot colors used, may be overridden in Settings:Style tab.
Styles / Width : Sets the plot style and width used, may be overridden in Settings:Style tab.
This indicator is designed to work with any chart timeframe, with the understanding that when used on timeframes higher than daily the indicator becomes "IntraPeriod" intensity, for example on weekly bars it would be "IntraWeek" intensity. On Daily or lower timeframes the indicator operates as "IntraDay" intensity and is being updated on each bar as each day progresses. If the experimental setting Intrabar is enabled then the indicator operates as "IntraBar" intensity and is no longer constrained to daily or higher evaluations, for example with Intrabar enabled on a 4H timeframe the indicator would operate as "Intra4H" intensity.
NOTICE: This is an example script and not meant to be used as an actual strategy. By using this script or any portion thereof, you acknowledge that you have read and understood that this is for research purposes only and I am not responsible for any financial losses you may incur by using this script!

comm_idxThis script displays information about the components of the Goldman Sachs Commodity Index. The index is based on futures contracts in the categories of agricultural products, softs commodities, livestock, energies, industrial metals, and precious metals. The statistics displayed in the table are:
change: 1-day % change
from ma: the % change from a moving average
corr idx: correlation of the contract to the GSCI
The lengths for the moving average and correlation statistic can be set using the inputs.
See the script source for the symbols used for each commodity. Although most of the symbols correspond to the actual futures contract used to compute the index, LME contracts are not available on tradingview. Hence, corresponding HKEX contracts are used for the industrial metals.
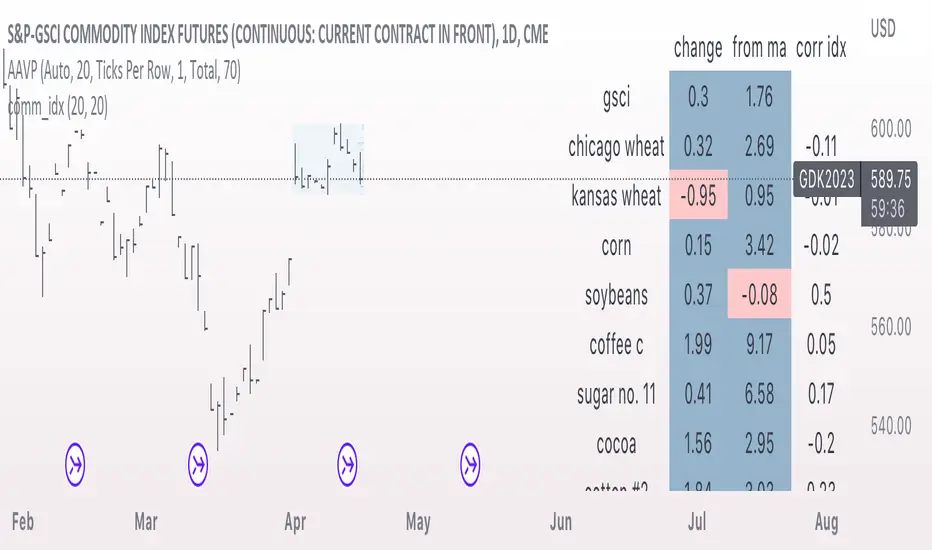
Global Index SMA OverlayGlobal Index SMA Overlay
The Global Index SMA Overlay indicator allows traders to compare the price movements of a chosen stock with a chosen global index by overlaying the SMA of the index onto the stock's price chart.
The indicator supports major global indexes such as the S&P 500, NASDAQ 100, Dow Jones, DAX, CAC 40, FTSE 100, Nikkei 225, and ASX 200.
The indicator normalizes the SMA value by applying the price ratio between the stock and the index, which allows traders to easily compare the relative performance of the stock with respect to the index.
The user can choose the length of the SMA and the index to compare against, making it a versatile tool for a variety of trading strategies.
With the Global Index SMA Overlay indicator, traders can quickly and easily identify trends and potential trading opportunities by comparing the price movements of a stock with a chosen global index.
