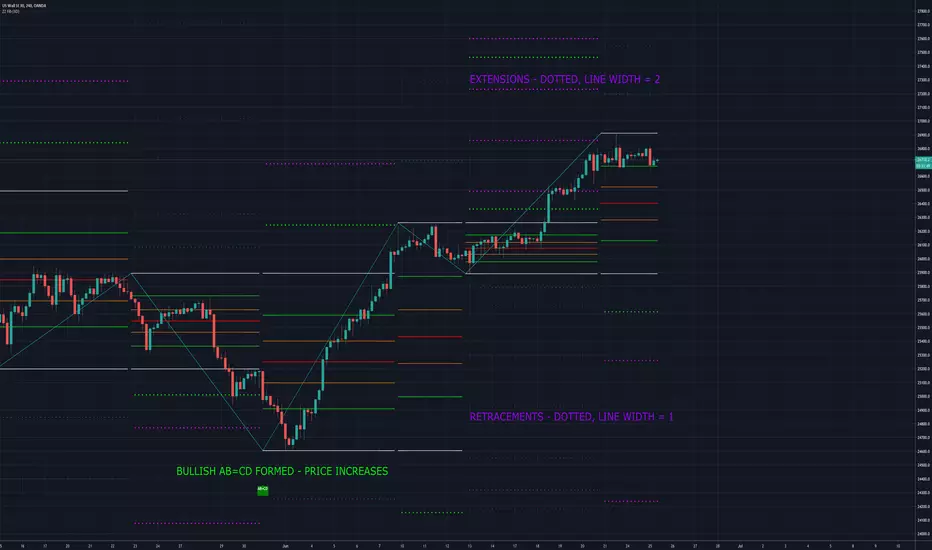
MoT - ZigZag Fibonacci w/Extensions + Chart Pattern RecognitionOne of my favourite indicators we have created over an extremely creative weekend while also watching Bitcoin keep pushing on! The Indicator plots ZigZags and then overlays Fibonacci Levels (With Extensions). I have also programmed the indicator to search for Bullish/Bearish chart patterns in the form of ABC's, ABCD's, 3 Drives, BAT etc etc. This evening we have also added multiple time frame (MTF) options.
Onda de Elliott

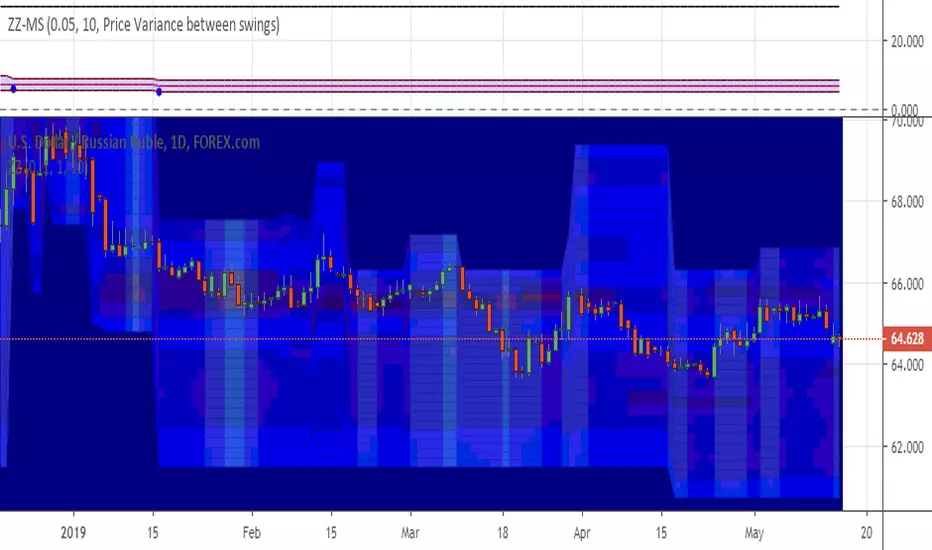
[RS]ZigZag Percent Reversal(Multiple) - Forecast Areasnaive level forecasting of multiple zigzag's
based on this principle:
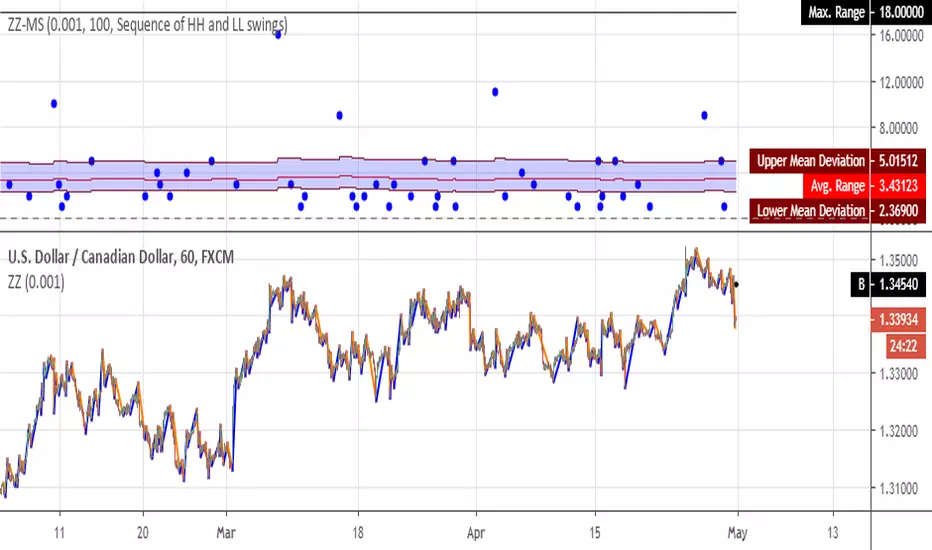
[RS]ZigZag Percent Reversal - Multiple StatisticsMultiple Statistics from zigzag:
• Price range between swings.
• Bar range between swings.
returns maximum value, avg value and mean deviation.
if you find something missing, please leave a message bellow.
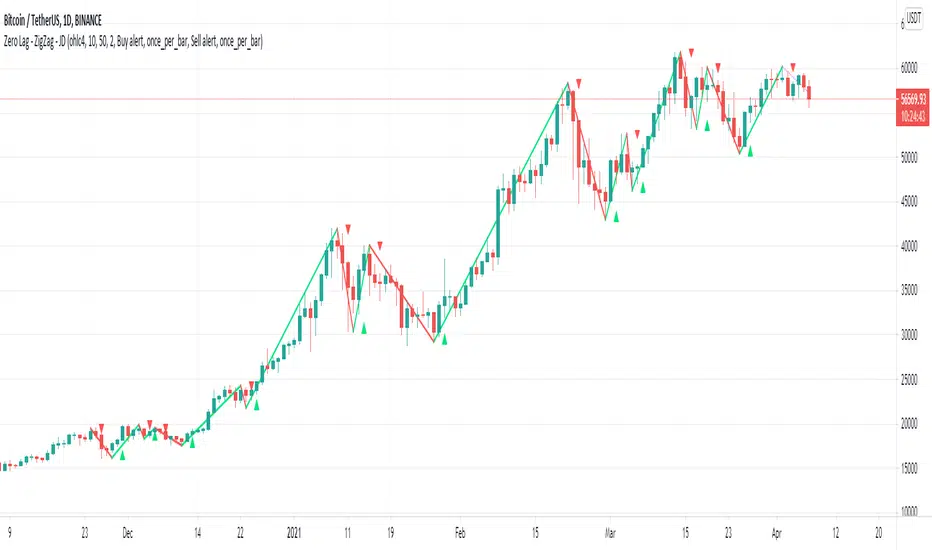
Zero Lag - ZigZag - JDThis is a alternative version of the well known "ZigZag indicator" but it uses turning points of the Jurik ma
instead of the traditional "pivot points" that are by definition lagging by a large lookback period, the (almost-) Zero Lag ZigZag lags by about 2 bars on average (depending on the candles forming)
The ZigZag pattern can be used to draw trendlines and S/R lines
It can also be used for "wave counting" in a way that reduces interpretation.
If you find other uses, please leave your ideas in the comments!
Shoutout to Everget for the awesome Jurik code!!
JD.
#NotTradingAdvice #DYOR
Simple LinesIntroduction
Making lines is great in technical analysis since it can highlights principal movements and make the analysis of the price easier when using certain methodologies (Elliott Waves, patterns).
However most of the indicators making lines (Zig-Zag, simple linear regression) are non causal (repaint), this is the challenge i tried to overcome, making an indicator capable of making lines in a smart way (able to follow price without loosing a linear approach) and with the least lag possible, i inspired myself from the behaviour of the renko when using a small brick size. This indicator does not repaint .
The code is short and i hope, understandable for all of you, making lines is not a difficult task and its important to know that when a problem appear complex it does not mean that the code used to solve this problem must be complex. Lets see the indicator in details.
The indicator
The indicator have 4 parameters, the length parameter who control the length of lines, the emphasis parameter who control the stability and also the ability to make lines closer to the price (thus minimizing the sum of squares) , the mult parameter which is similar to emphasis and a point option that we will discuss later.
When emphasis and mult are both equal to 1 the indicator will sometimes draw a perfect line, however this line will try to follow the price and thus can create a noisy result.
This is where emphasis and mult will correct this behaviour. The emphasis parameter give a more periodic look as well as some control to the lines but can also destroy them.
This should not happen with mult , this parameter also give more predictability to the lines. Overall it correct the drawbacks of the parameters combinations mentioned earlier.
Its also possible to mix both the emphasis and mult parameter, but take into account that when both are equals the result consist of less reactive lengthy lines with low accuracy. Its better to only use one of them and let the other stay to 1.
Point Option
The indicator can sometimes have a weird look, appearing almost flat or just dont appearing at all. When such thing happen use the point option.
XPDUSD without point option.
with point option :
Time Frame Problem and Its Fix
When using higher time-frames the result of the indicator can appear different, in general the higher the time frame the lengthier are the lines. In order to fix this you can use decimals in the length parameter
length and mult both equal to 5.5, emphasis cant use decimals.
Conclusion
I have highlighted a simple way to make use of the small renko box size method in order to return reactive lines without making the indicator repaint. However Its ability to be close to the price as well as being always super reactive is not a guarantee.
For any suggestion/help feel free to pm me, i would be happy to help you :)

Divergences for many indicators v2.0A gift from me to all.
This script is developed to find Divergences for many indicators. it analyses divergences and then draws line on the graph. red for negatif, lime for positive divergences.
Currently script checks divergence for RSI, MACD, MACD Histogram, Stochastic, CCI, Momentum, OBV, Diosc, VWMACD and CMF indicators. You can use some or all of these indicators to check divergences as you wish by choosing them on the menu. Also you can add/remove many other indicators to the script to check if there is divergence.
The script first calculates tops/bottoms by using higher time frame zig zag and then finds divergences.
Higher Time Frames are
if currend period 1 min => HTF = 5 mins
if currend period 3 mins => HTF = 15 mins
if currend period 5 mins => HTF = 15 mins
if currend period 15 mins => HTF = 1 hour
if currend period 30 mins => HTF = 1 hour
if currend period 45 mins => HTF = 1 hour
if currend period 1 hour => HTF = 4 hours
if currend period 2 hours => HTF = 4 hours
if currend period 3 hours => HTF = 4 hours
if currend period 4 hours => HTF = 1 day
if currend period 1 day => HTF = 1 week
if currend period 1 week => HTF = 1 week
future plan : script finds regular divergences, soon I will add hidden divergences and also I plan to add alert ;)

Fractal FramerThis indicator constructs dynamic high/low price range levels, based on 3 point fractals. Trend lines are drawn (zigzag style) at fractal points when trend direction is clearly established.
This is a lagging indicator: fractals lag by one bar and trend lines can lag by many bars. However, its strength lays in objectively defining historic price action: e.g. support/resistance levels and waves within a trend.
See the comments at the beginning of the script for a complete description.

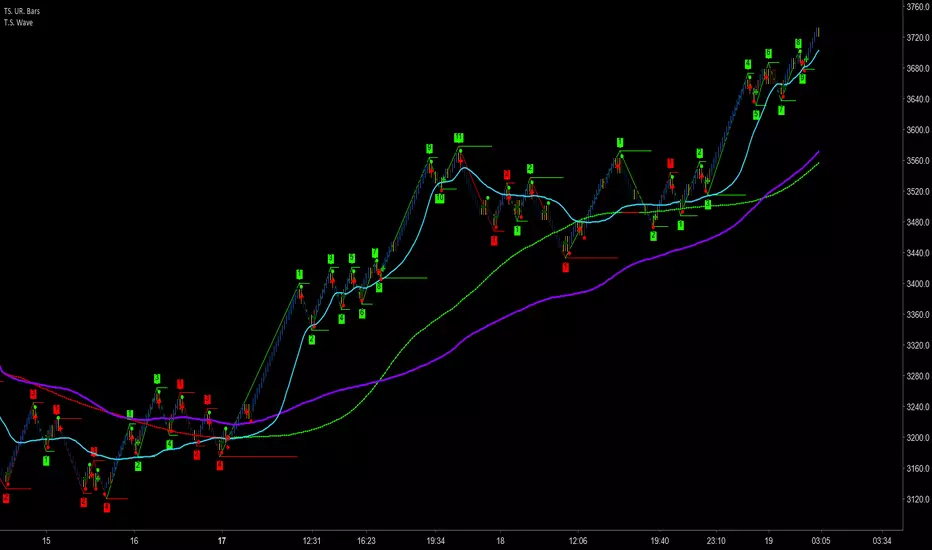
Trader Set - Wave CountThis is a wave counting tool for my methodology with little addition of drawing high low sections of wave reversal as local support / resistance.
Please don't contact me for getting access, these tools are only available for my students. The English version of website and learning materials are under development and soon they will be ready. I will announce it under every script related to my methodology so that you get informed and participate in the course if you want to.
Market Compass [yoxxx]For all markets and all timeframes,
based on Constance Brown's observation, that rsi bull range is 40 to 80 and bear's 20 to 65 (almost strictly).
The histogramm tells you which longer term market you#re in.
The short term curves identify the wave within the trend (similat to EW impulse / corrective) incl. overdoing action
Example: longterm= green, wave =red--> Bullmarket, corrective wave etc.
(I locked this one to remind you that the length of the indicators are essential)

Gann Swings Trend CounterBased on Rick Santos ' Swing Charts V1 Darvas Box V0.1'
However I have migrated script to pine version 3, customized to suite and added a higher number for the trend count

ZigZag Repaint Examplesimple example showing how to use na to create straight lines that "repaint" as the latest bars update.

BullTrading ZigZagSome people say the ZigZag indicator is the Holy Grail... I think half of this statement is true :)
This is an alert friendly ZigZag indicator with MultiTimeframe Capabilities, it will alert you each time the ZigZag plots a new line (Higher Timeframe ZigZags are plotted with respective timeframe offset).
Note: The indicator works on higher timeframes (D and above)
Default Resolution is D, adjust resolution to your favorite timeframe and Min %
Use in conjunction with your Fib tool and enjoy.

Weis Wave ChartThis indicator is based on the Weis Wave described by David H. Weis in his book Trades About to Happen: A Modern Adaptation of the Wyckoff Method, more info how to use this indicator can be found in this video . The Weis Wave is an adaptation of Richard D. Wyckoff’s method Wave Charts. It works in all time periods and can be applied to all asset types.
Unlike other implementations I found here on TradingView, this implementation make use of a Renko-like zig zag pattern, very similar to how it is described in David H. Weis' book. The settings for the zig zag pattern are very similar to the standard Renko settings here on TradingView, in the "Renko Assignment Method" you either chose "ATR" or "Traditional" (read more about it here ). The ATR length or the brick size is then entered in the textbox "Value". You can also chose another setting in the "Renko Assignment Method" drop down named "Part of Price" which calculate the brick size from the current close and divide it by the value in the text box "Value". It is also possible to chose if the zig zag pattern shall use the high/low, the open/close or just the close as the most extreme values in its calculation, you select this in the drop down "Price Source".
TradingView's pine script does currently not support to print non-static text on the chart, so it is not possible at this point to write out the volume on the zig zag chart. It is also not possible to have both an overlay and separate chart pane in the same indicator, therefor this indicator is split up in two.
You can find the volume indicator here:

Weis Wave VolumeThis indicator is based on the Weis Wave described by David H. Weis in his book Trades About to Happen: A Modern Adaptation of the Wyckoff Method, more info how to use this indicator can also be found in this video . The Weis Wave is an adaptation of Richard D. Wyckoff’s method Wave Charts. It works in all time periods and can be applied to all asset types. For assets that do not support volume Weis propose in his book to use the true range instead, so if you want to use this indicator for assets that do not support volume, make sure to enable the checkbox "Use True Range instead of Volume".
Unlike other implementations I found here on Trading, this implementation make use of a Renko-like zig zag pattern, very similar to how it is described in David H. Weis' book. The settings for the zig zag pattern are very similar to the standard Renko settings here on TradingView, in the "Renko Assignment Method" you either chose "ATR" or "Traditional" (read more about it here ). The ATR length or the brick size is then entered in the textbox "Value". You can also chose another setting in the "Renko Assignment Method" drop down named "Part of Price" which calculate the brick size from the current close and divide it by the value in the text box "Value". It is also possible to chose if the zig zag pattern shall use the high/low, the open/close or just the close as the most extreme values in its calculation, you select this in the drop down "Price Source". If you want the price to oscillate around a zero value, enable the "Oscillating" checkbox.
TradingView's pine script does currently not support to print non-static text on the chart, so it is not possible at this point to write out the volume on the zig zag chart. It is also not possible to have both an overlay and separate chart pane in the same indicator, therefor this indicator is split up in two.
You can find the zig zag indicator here:


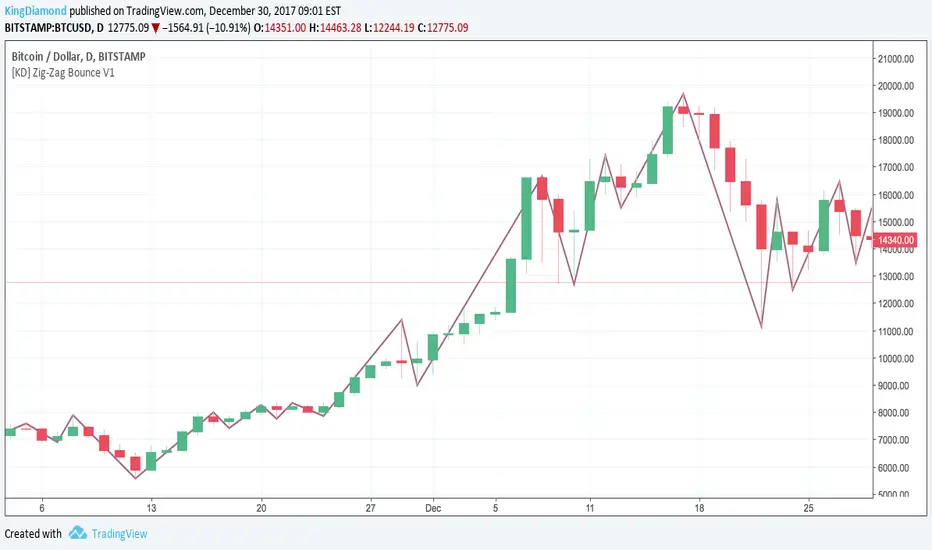
[KD] Zig-Zag Bounce V1Cut through chart noise with Zig-Zag Bounce!
Every time the trend bounces, we show you the highs and lows giving you an incredibly clear overview. Makes it much easier to spot where your Elliott Waves should fit :)
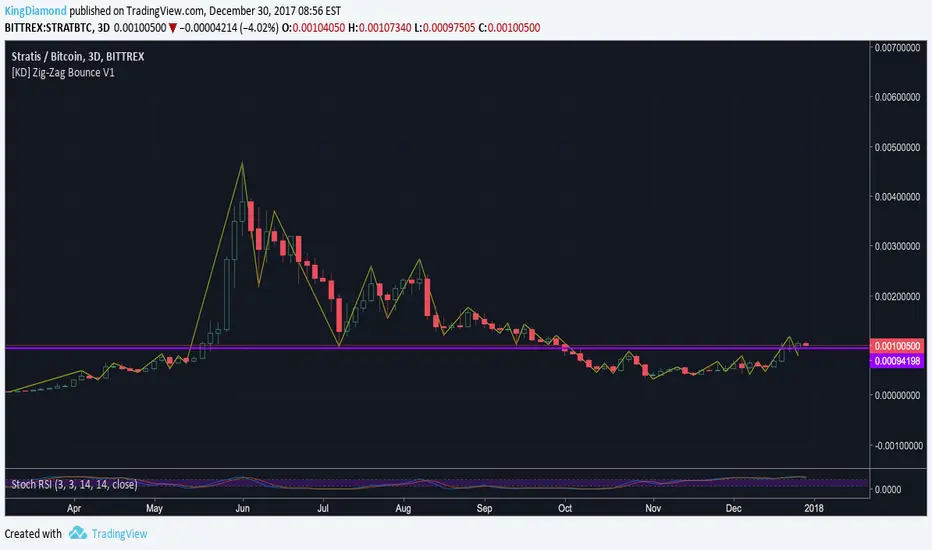
[KD] Zig-Zag Bounce V1Cut through chart noise with Zig-Zag Bounce!
Every time the trend bounces, we show you the highs and lows giving you an incredibly clear overview. Makes it much easier to spot where your Elliott Waves should fit :)

Fractal Composite Ribbon V2.1Added alerts when L1 fast or L2 med-fast pop out of grey hysteresis state into red or green. These new alerts do not require being in shaded overbought/oversold zones so they're better for catching continuation moves. Thanks to fbatistat for the suggestion.
Also exposed the "Cross Hysteresis" parameter for the width of ambiguous grey "slack" before lead lines push into red or green.

Fractal Composites Ribbon (V2)Compresses 8 fractal oscillator timescales into a ribbon of up to 5 composite lines.
This is a smoother version of the original Fractal Composite with alerts on reversals in the overbought/oversold zones.
Fractal Composites normalize and 'cartoonize' the price chart to fit and bounce between statistically-defined overbought and oversold zones. Each lines resembles the shape of the price wave on a different time/size scale, with some distortion as the size of price movement fluctuates. Conceptually, reaching the overbought/oversold zone corresponds to price reaching a ribbon of Bollinger bands, though our 'band statistics' are much smoother and more mathematically sophisticated than standard Bollinger.
Because markets have similar fractal behavior across all timescales, this indicator applies to any timescale, from 1 minute to 1 hour or 1 day. You shouldn't really need to futz with the numerical parameters -- the most important choice is your chart timescale for how fast you want to trade. A faster timescale will show you more dotted reversals in the overbought/oversold zones to trade. The 'Show...' checkboxes let you choose how many composite lines, lag lines, and crosses to see. Information overload? Or a reminder that any single indicator embeds many assumptions about time and price scale in its signal...
