Position resetThe "Position Reset" indicator
The Position Reset indicator is a sophisticated technical analysis tool designed to identify possible entry points into short positions based on an analysis of market volatility and the behavior of various groups of bidders. The main purpose of this indicator is to provide traders with information about the current state of the market and help them decide whether to open short positions depending on the level of volatility and the mood of the main players.
The main components of the indicator:
1. Parameters for the RSI (Relative Strength Index):
The indicator uses two sets of parameters to calculate the RSI: one for bankers ("Banker"), the other for hot money ("Hot Money").
RSI for Bankers:
RSIBaseBanker: The baseline for calculating bankers' RSI. The default value is 50.
RSIPeriodBanker: The period for calculating the RSI for bankers. The default period is 14.
RSI for hot money:
RSIBaseHotMoney: The baseline for calculating the RSI of hot money. The default value is 30.
RSIPeriodHotMoney: The period for calculating the RSI for hot money. The default period is 21.
These parameters allow you to adjust the sensitivity of the indicator to the actions of different groups of market participants.
2. Sensitivity:
Sensitivity determines how strongly changes in the RSI will affect the final result of calculations. It is configured separately for bankers and hot money:
SensitivityBanker: Sensitivity for bankers' RSI. It is set to 2.0 by default.
SensitivityHotMoney: Sensitivity for hot money RSI. It is set to 1.0 by default.
Changing these parameters allows you to adapt the indicator to different market conditions and trader preferences.
3. Volatility Analysis:
Volatility is measured based on the length of the period, which is set by the volLength parameter. The default length is 30 candles. The indicator calculates the difference between the highest and lowest value for the specified period and divides this difference by the lowest value, thus obtaining the volatility coefficient.
Based on this coefficient, four levels of volatility are distinguished.:
Extreme volatility: The coefficient is greater than or equal to 0.25.
High volatility: The coefficient ranges from 0.125 to 0.2499.
Normal volatility: The coefficient ranges from 0.05 to 0.1249.
Low volatility: The coefficient is less than 0.0499.
Each level of volatility has its own significance for making decisions about entering a position.
4. Calculation functions:
The indicator uses several functions to process the RSI and volatility data.:
rsi_function: This function applies to every type of RSI (bankers and hot money). It adjusts the RSI value according to the set sensitivity and baseline, limiting the range of values from 0 to 20.
Moving Averages: Simple moving averages (SMA), exponential moving averages (EMA), and weighted moving averages (RMA) are used to smooth fluctuations. They are applied to different time intervals to obtain the average values of the RSI.
Thus, the indicator creates a comprehensive picture of market behavior, taking into account both short-term and long-term dynamics.
5. Bearish signals:
Bearish signals are considered situations when the RSI crosses certain levels simultaneously with a drop in indicators for both types of market participants (bankers and hot money).:
The bankers' RSI crossing is below the level of 8.5.
The current hot money RSI is less than 18.
The moving averages for banks and hot money are below their signal lines.
The RSI values for bankers are less than 5.
These conditions indicate a possible beginning of a downtrend.
6. Signal generation:
Depending on the current level of volatility and the presence of bearish signals, the indicator generates three types of signals:
Orange circle: Extremely high volatility and the presence of a bearish signal.
Yellow circle: High volatility and the presence of a bearish signal.
Green circle: Low volatility and the presence of a bearish signal.
These visual markers help the trader to quickly understand what level of risk accompanies each specific signal.
7. Notifications:
The indicator supports the function of sending notifications when one of the three types of signals occurs. The notification contains a brief description of the conditions under which the signal was generated, which allows the trader to respond promptly to a change in the market situation.
Advantages of using the "Position Reset" indicator:
Multi-level analysis: The indicator combines technical analysis (RSI) and volatility assessment, providing a comprehensive view of the current market situation.
Flexibility of settings: The ability to adjust the sensitivity parameters and the RSI baselines allows you to adapt the indicator to any market conditions and personal preferences of the trader.
Clear visualization: The use of colored labels on the chart simplifies the perception of information and helps to quickly identify key points for entering a trade.
Notification support: The notification sending feature makes it much easier to monitor the market, allowing you to respond to important events in time.
Banker

LOKEN (v4) BULLISH SMART MONEYThis indicator is based on Smart Money MCDX
(Pine editor @v4)
Indicator built for cryptocurrencies.
Best for day trading.
The coin seems overbought but still pump? Check this indicator
This indicator help you see when institutional buyer enter/exit trade and is a good combination with RSI + Stochastic RSI .
This indicator focus on buying activity by big players and is built for LONG or SPOT, shorter can still use it to determine when to exit short (if smart money appear on a significant TF you may not enter/stay in a short).
Banker plot show strong buyer activities (appear generally when RSI already overbought but still increasing).
It appear as a Histogram with a color code to better see the fading strength of the institutional activity :
Light Blue Bar = Institutional presence ( bullish )
Green Bar = Pump candle (very bullish ), (Banker > Banker MA)
Orange Bar = Retest candle = natural decline after a growth (Banker < Banker MA)
Black Bar = Down candle = progressive exit of institutional leads to this candle, you must have TP before.
Red Bar = Dump candle = steep decline, the institutional take profit hard. You better be out before that one.
Hot-Money plot show momentum and react fast to price action.
It appear as a filled zone (red or green) depending on the plot position compared to its average.
In a downtrend you may only see this one.
Key-Signals:
"Bullish signal 𓃓" = open a long
"Sell signal 💲" = close the long
I recommend you don't keep all the signals enabled at first.
(feel free to ask me the use of the other signals)
It seemed to me that SMART MONEY MCDX was counter-intuitive and archaic,
So i made this one for personal use,
I'm happy if this indicator helps you,
Have a good trade

Baz: Mcdx HeatmapThis indicator is to detect buying and selling momentum based on volume and price action with multiple timeframe mcdx.
Improve version of mcdx to let you see clearly real-time changes in 15mins, 30mins, 1h, 2h, 4h, 1D of the mcdx value.
Heatmap:
Green > Yellow > Orange > Red = Retailer shifting to banker
How it works?
The color subsides based on the resolution of chart, for example
We should focus on larger timeframe, which is >50 on the heatmap. Giving a clear signal that banker is still involved.
For value <50 on heatmap, you get faster signal without changing to smaller timeframe getting all the mcdx value, which save us a lot of time to look at bigger picture what is going on.
For example,
Lets check on each timeframe chart, starting from 15mins
For 15mins and 30min chart, mcdx is < 50
For 1H chart, mcdx is about 50
For 2H, 4H 1D, mcdx > 90

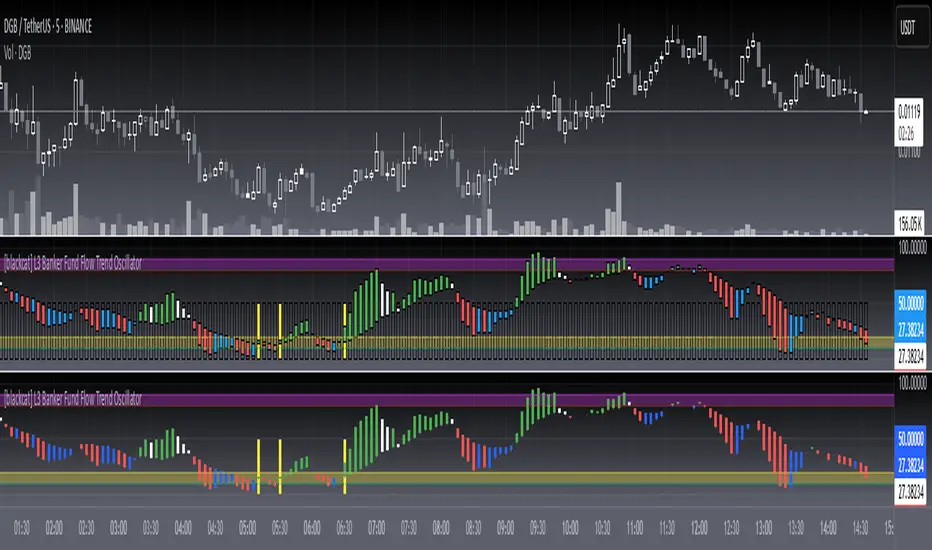
[blackcat] L3 Banker Fund Flow Trend OscillatorLevel: 3
Background
The large funds or banker fund are often referred to as Whale. Whale can have a significant impact on the price movements in various markets, especially in cryptocurrency . Therefore, how to monitor Whale trends is of great significance both in terms of fundamentals and technical aspects.
Function
L3 Banker Fund Flow Trend Oscillator can give you a model of complete banker fund flow operation in cycles. Although the script is not so complicated, it is comprehensive to disclose the price trend. That is the reason why I list this as Level 3. Each cycle of banker fund flow may have 5 steps in max as entry, increase position, decrease position, exit, and weak rebound for exit.
Key Signal
1. banker fund entry with yellow candle
2. banker increase position with green candle
3. banker decrease position with white candle
4. banker fund exit/quit with red candle
5. banker fund weak rebound with blue candle
Pros and Cons
Pros:
1. Model banker fund behavior in complete cycles
2. Overbought and oversold can be directly observed due to oscillator nature
3. the transition points are clear for entry or exit
Cons:
1. Simple modelling, no further complex behaviors can be disclosed
2. trade by trend following the banker fund, it is still under the trend analysis prerequisite
Remarks
I believe you will like this one.
Readme
In real life, I am a prolific inventor. I have successfully applied for more than 60 international and regional patents in the past 12 years. But in the past two years or so, I have tried to transfer my creativity to the development of trading strategies. Tradingview is the ideal platform for me. I am selecting and contributing some of the hundreds of scripts to publish in Tradingview community. Welcome everyone to interact with me to discuss these interesting pine scripts.
The scripts posted are categorized into 5 levels according to my efforts or manhours put into these works.
Level 1 : interesting script snippets or distinctive improvement from classic indicators or strategy. Level 1 scripts can usually appear in more complex indicators as a function module or element.
Level 2 : composite indicator/strategy. By selecting or combining several independent or dependent functions or sub indicators in proper way, the composite script exhibits a resonance phenomenon which can filter out noise or fake trading signal to enhance trading confidence level.
Level 3 : comprehensive indicator/strategy. They are simple trading systems based on my strategies. They are commonly containing several or all of entry signal, close signal, stop loss, take profit, re-entry, risk management, and position sizing techniques. Even some interesting fundamental and mass psychological aspects are incorporated.
Level 4 : script snippets or functions that do not disclose source code. Interesting element that can reveal market laws and work as raw material for indicators and strategies. If you find Level 1~2 scripts are helpful, Level 4 is a private version that took me far more efforts to develop.
Level 5 : indicator/strategy that do not disclose source code. private version of Level 3 script with my accumulated script processing skills or a large number of custom functions. I had a private function library built in past two years. Level 5 scripts use many of them to achieve private trading strategy.
[blackcat] L1 Banker Entry IndicatorLevel: 1
Background
@testtttt1111 inquired me how to model banker entry
Function
L1 Banker Entry Indicator demostrates a simple model of banker entry for long or short
Key Signal
bankerthreshold ---> customized input for threshold value for banker move identification
pumpdumpsoon ---> alerts for pump or dump start soon in green color
longshortentry ---> alerts for long or short entry in orange color
bankermove ---> alerts for banker move in yellow color
Pros and Cons
Pros:
1. indicating banker move and entries
2. simple classification of banker move alerts
Cons:
1. no direction can be identified
2. no volume information is utilized for big fund move
Remarks
A demo for banker entry inquired by @testtttt1111
Readme
In real life, I am a prolific inventor. I have successfully applied for more than 60 international and regional patents in the past 12 years. But in the past two years or so, I have tried to transfer my creativity to the development of trading strategies. Tradingview is the ideal platform for me. I am selecting and contributing some of the hundreds of scripts to publish in Tradingview community. Welcome everyone to interact with me to discuss these interesting pine scripts.
The scripts posted are categorized into 5 levels according to my efforts or manhours put into these works.
Level 1 : interesting script snippets or distinctive improvement from classic indicators or strategy. Level 1 scripts can usually appear in more complex indicators as a function module or element.
Level 2 : composite indicator/strategy. By selecting or combining several independent or dependent functions or sub indicators in proper way, the composite script exhibits a resonance phenomenon which can filter out noise or fake trading signal to enhance trading confidence level.
Level 3 : comprehensive indicator/strategy. They are simple trading systems based on my strategies. They are commonly containing several or all of entry signal, close signal, stop loss, take profit, re-entry, risk management, and position sizing techniques. Even some interesting fundamental and mass psychological aspects are incorporated.
Level 4 : script snippets or functions that do not disclose source code. Interesting element that can reveal market laws and work as raw material for indicators and strategies. If you find Level 1~2 scripts are helpful, Level 4 is a private version that took me far more efforts to develop.
Level 5 : indicator/strategy that do not disclose source code. private version of Level 3 script with my accumulated script processing skills or a large number of custom functions. I had a private function library built in past two years. Level 5 scripts use many of them to achieve private trading strategy.
