[RS]Linear Regression Bands V2EXPERIMENTAL:
added titles to inputs and plots for better understanding what is what(DCC)
M = middle, T = top, B = bottom, S = signal.
Bands

MA_FibBand_MTFMoving average of High, Low & Close with Fibonacci bands calculated from the average high and low. Four upper levels are to the power of 1.618, 2.618, 3.618 & 4.618. Four lower levels are to the power of 0.618, 1.618, 2.618 & 3.618. Included are a choice of time frames either current, semi-custom or fully custom allowing freedom to set any period you like which makes it great for historical averages. Adapted and expanded from Clarke Moody's MA_MTF i have tidied the script and included all CM's formulas although should be used in SMA or EMA i kept the other MA formulas for curiosity.
My preferred usage is to stick with 20ma and adjust the legnth of the period. Shown here is 20ema of 10day period.
More information can be learnt from 'endlessmountain' on youtube but only the very top and bottom levels are used with the High, Low & Close. Also i am not aware if this originates from any other source.
Thankyou to Clarke Moody and endlessmountain. Hope you like this tool.


Acc/Dist. Cloud with Fractal Deviation Bands by @XeL_ArjonaACCUMULATION / DISTRIBUTION CLOUD with MORPHIC DEVIATION BANDS
Ver. 2.0.beta.23:08:2015
by Ricardo M. Arjona @XeL_Arjona
DISCLAIMER
The Following indicator/code IS NOT intended to be a formal investment advice or recommendation by the author, nor should be construed as such. Users will be fully responsible by their use regarding their own trading vehicles/assets.
The embedded code and ideas within this work are FREELY AND PUBLICLY available on the Web for NON LUCRATIVE ACTIVITIES and must remain as is.
Pine Script code MOD's and adaptations by @XeL_Arjona with special mention in regard of:
Buy (Bull) and Sell (Bear) "Power Balance Algorithm by Vadim Gimelfarb published at Stocks & Commodities V. 21:10 (68-72).
Custom Weighting Coefficient for Exponential Moving Average (nEMA) adaptation work by @XeL_Arjona with contribution help from @RicardoSantos at TradingView @pinescript chat room.
Morphic Numbers (PHI & Plastic) Pine Script adaptation from it's algebraic generation formulas by @XeL_Arjona
Fractal Deviation Bands idea by @XeL_Arjona
CHANGE LOG:
ACCUMULATION / DISTRIBUTION CLOUD: I decided to change it's name from the Buy to Sell Pressure. The code is essentially the same as older versions and they are the center core (VORTEX?) of all derived New stuff which are:
MORPHIC NUMBERS: The "Golden Ratio" expressed by the result of the constant "PHI" and the newer and same in characteristics "Plastic Number" expressed as "PN". For more information about this regard take a look at: HERE!
CUSTOM(K) EXPONENTIAL MOVING AVERAGE: Some code has cleaned from last version to include as custom function the nEMA , which use an additional input (K) to customise the way the "exponentially" is weighted from the custom array. For the purpose of this indicator, I implement a volatility algorithm using the Average True Range of last 9 periods multiplied by the morphic number used in the fractal study. (Golden Ratio as default) The result is very similar in response to classic EMA but tend to accelerate or decelerate much more responsive with wider bars presented in trending average.
FRACTAL DEVIATION BANDS: The main idea is based on the so useful Standard Deviation process to create Bands in favor of a multiplier (As John Bollinger used in it's own bands) from a custom array, in which for this case is the "Volume Pressure Moving Average" as the main Vortex for the "Fractallitly", so then apply as many "Child bands" using the older one as the new calculation array using the same morphic constant as multiplier (Like Fibonacci but with other approach rather than %ratios). Results are AWSOME! Market tend to accelerate or decelerate their Trend in favor of a Fractal approach. This bands try to catch them, so please experiment and feedback me your own observations.
EXTERNAL TICKER FOR VOLUME DATA: I Added a way to input volume data for this kind of study from external tickers. This is just a quicky-hack given that currently TradingView is not adding Volume to their Indexes so; maybe this is temporary by now. It seems that this part of the code is conflicting with intraday timeframes, so You are advised.
This CODE is versioned as BETA FOR TESTING PROPOSES. By now TradingView Admins are changing lot's of things internally, so maybe this could conflict with correct rendering of this study with special tickers or timeframes. I will try to code by itself just the core parts of this study in order to use them at discretion in other areas. ALL NEW IDEAS OR MODIFICATIONS to these indicator(s) are Welcome in favor to deploy a better and more accurate readings. I will be very glad to be notified at Twitter or TradingView accounts at: @XeL_Arjona

Bollinger Band TouchThis script simply colors the background when price hits or exceeds the bollinger bands. Just a nice visual cue.

[RS]Bollinger Bands Breakout Candles V0EXPERIMENTAL: a experiment using bollingers and directional momentum, Breakout detector.
[RS]Linear Regression Bands V1experiment with linear regression, the purpose was to catch break outs early, but it creates to much visual noise
same as version 0 but with added margin filter and signal to mark entrys

Yacine EMA Bands V2Version 2, because of popular demand.
Default values are weekly.
Feel free to try other configurations.

Variable Moving Average Bands [LazyBear]VMA Bands are ATR bands with VMA as its centre. For a description of options, refer to my VMA post:
I have moved VMA calculation in to a separate function. Feel free to use calc_vma() in your scripts. For more MA calculation function (KAMA, VIDYA and others), refer to my complete list of indicators below.
Wish you all a very prosperous New year. Hope these indicators make you all more money this year too :)
List of my other indicators:
- GDoc: docs.google.com
- Chart:

Historical Volatility based Standard Deviation_V2This Plots the Standard Deviation Price Band based on the Historical Volatility. SD 1, 2, 3.
Version update:
Fixed the Standard Deviation mistake on Version 1.
Added Smoothing Options for those who prefer a less choppy version.
Standard Deviation 3 plot is not set to Default

UCSgears_Transaction Valuation IndexThis is an indicator, That works great in a wip-saw market range. Would not use this to trade in a breakout.
I am calling it the "Transaction Value Index (UCS_TVI)", The reason is because, it measure where the price currently from the mean trade value.
The cross represents the highest trade value on that day, circle represents the lowest trade value.
In other words, Top and bottom of the candle wicks, in relation to the mean trade value (MTV).
Watchout for Further Updates on Optimizing this indicator.
DO NOT CONFUSE IT WITH FUNDAMENTAL VALUATION, THIS IS PURELY TECHNICAL VALUATION TECHNIQUE
As Usual, Good Luck
List of All my Indicators - www.tradingview.com

UCS_Value BandsThis Indicator is yet another variation of KC. Inspired from Value Charts webinar. I have seen their videos on youtube. What appears to be a variation of KC.
They use 12 bands Showing the zone, and different MA for different timeframes.
You can get this indicator close to accuracy by changing the inputs (ATR) and (Deviations)
This also can be used with the triple ATR setup - Change the values to EMA to desired value. To obtain the First band to plot @ 1, Change the Band deviation to 0.25.
Also can be used as as the Acceleration Band. With Current Settings, the Third Band will plot the Acceleration band.
List of All my Indicators - www.tradingview.com
Lycka Till

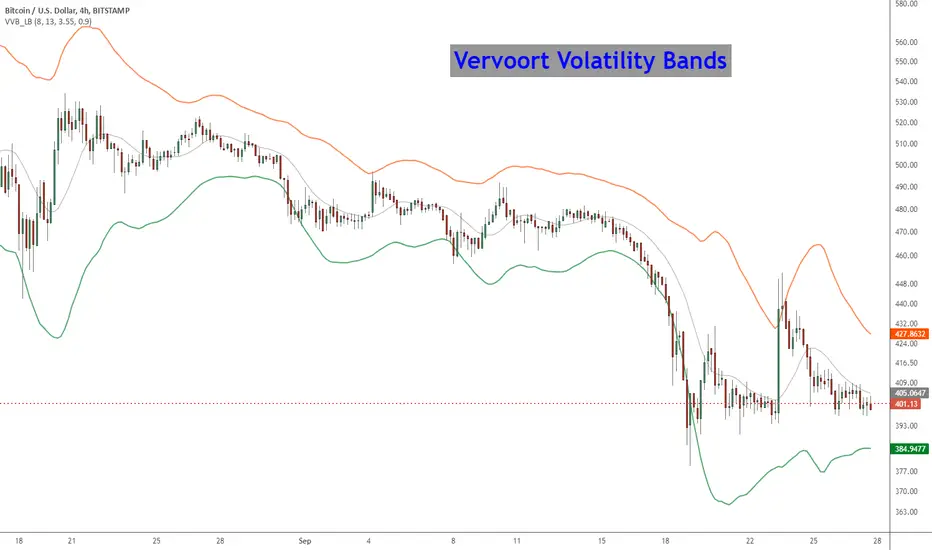
Vervoort Volatility Bands [LazyBear]This is Mr. Vervoort's take on volatility bands. Sticking to his style, he uses highly smoothed data everywhere, also improves on the way the bands are calculated. Is this better than others? I will let you guys decide :)
More info:
www.traders.com
List of my other indicators:
- Chart:
- GDoc: docs.google.com
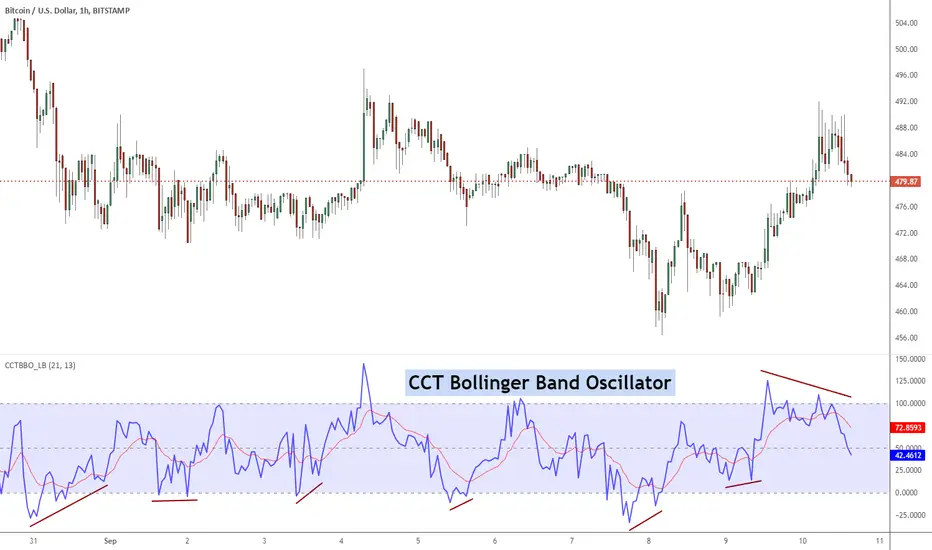
CCT Bollinger Band OscillatorThe CCT Bollinger Band Oscillator (CCTBO), developed by Steve Karnish of Cedar Creek Trading, reconfigures John Bollinger's classic Bollinger Bands (envelopes plotted at two Standard Deviations above and below a moving average) by drawing two parallel lines replacing the envelopes. The parallel lines represent a measurement of two Standard Deviations from the mean and are assigned a value of zero and 100 on the chart.
The indicator represents the price as it travels above and below the mean (50%) and outside the two standard deviations (zero and 100). Penetration of the upper band represents overbought conditions while penetration of the lower band signifies oversold conditions. Usage of the CCT Bollinger Band Oscillator to identify 'failure swings' and 'divergences' can lead to significant reversals.
List of my other indicators:
- Chart:
- GDoc: docs.google.com
vdubongCustom script I fabricated which I use for Binary Trading on the 1m & 3m charts together with Price action & Time management but the principles are the same for all mediums. Use Price action buy/sell in the clear zones. Use the outer 'pink' horizontal lines (highs / lows / pivots points) to place SL's.
I personally run an additional BB 50/2 for clearer BB higher highs & lower low perspective, but it's not part of the script. Script variables are fully customisable.
I don't take ownership of any part of the script, I not a programmer /script writer just a dabbler. Enjoy :) - VDUBONG UPDATED

RSI Bands, RSI %B and RSI BandwidthRSI bands provide an intuitive way of visualizing how the price movement causes RSI to move with in its range (0-100). Upper/Lower bands signify overbought and oversold levels respectively (Default: 70/30, you can customize them via options page). These bands closely match what Constance Brown explains in her book "Technical Analysis for the Trading Professional".
I have also coded up 2 scripts to visualize %B and Bandwidth, just as in BollingerBands. As you can see %B is equivalent to the actual RSI. Along with RSI_Bandwidth and %B, the bands convey a lot of information.
Another tip is to render Bollinger Bands along with RSIBands...endless possibilities :)
I have included all 3 scripts in the same chart, as they are all related. Since TradingView doesn't allow sharing more than one script in the same chart, you can only "Add script" RSI Bands.
If you want to use RSI %B and Bandwidth, follow this guide to "Make mine" this chart and get access to the source:
drive.google.com
For the complete list of my indicators, check this post:

DEnvelope [Better Bollinger Bands]*** ***
Bollinger Bands (BB) usually expand quickly after a volatility increase but contract more slowly as volatility declines. This extended time it takes for BB to contract after a volatility drop can make trading some instruments using BB alone difficult or less profitable.
In the October 1998 issue of "Futures" there is an article written by Dennis McNicholl called "Better Bollinger Bands", in which the author recommends improving BB by modifying:
- the center line formula &
- different equations for calculating the bands.
These bands, called "DEnvelope", follow price more closely and respond faster to changes in volatility with these modifications.
Fore more indicators, check out my "Master Index of indicators" (Also check my published charts page for new ones I haven't added to that list):
More scripts related to DEnvelope:
------------------------------------------------
- DEnvelope Bandwidth: pastebin.com
- DEnvelope %B : pastebin.com
Sample chart with above indicators: www.tradingview.com

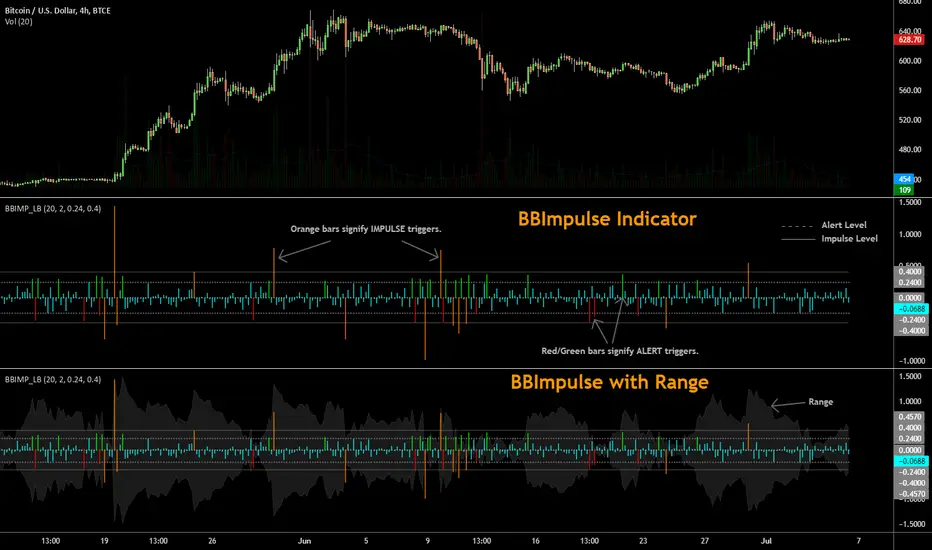
BBImpulse IndicatorBBImpulse is part of the latest indicators package offered by John Bollinger. Excerpt from their market blurb (www.bbforex.com):
"BBImpulse is derived from %b. Its value is the periodic change of %b, so if %b was 0.45 this period and 0.20 last period the present value of BBImpulse is 0.25. We present two reference levels on the chart, an alert level and an impulse level."
"Generally the market moves in the direction of the latest alerts and/or impulses except towards the end of a move where one can take advantage of exhaustion/reversal signals from this indicator."
"Ian Woodward employs BBImpulse for his Kahuna signals using key levels of 0.24 and 0.40."
I added support for the following:
- Highlighting alert/impulse trigger bars
- Rendering the range (check options page).
I noticed that the range, by itself, highlights lot of info:
- Tapering in (narrowing) of range may signify topping or falling prices.
- Tapering out (expanding) may signify nearing a bottom or rising prices.
- Range getting "ranged" between alert or impulse levels signify a major move in the direction of the last impulse trigger. I think for this, alert level ranging intensity is greater than impulse level ranging intensity.
Someone more familiar with BB will have more observations, I am sure. Please do share here so we BB noobs can learn :)
For more indicators, check out my complete list here:
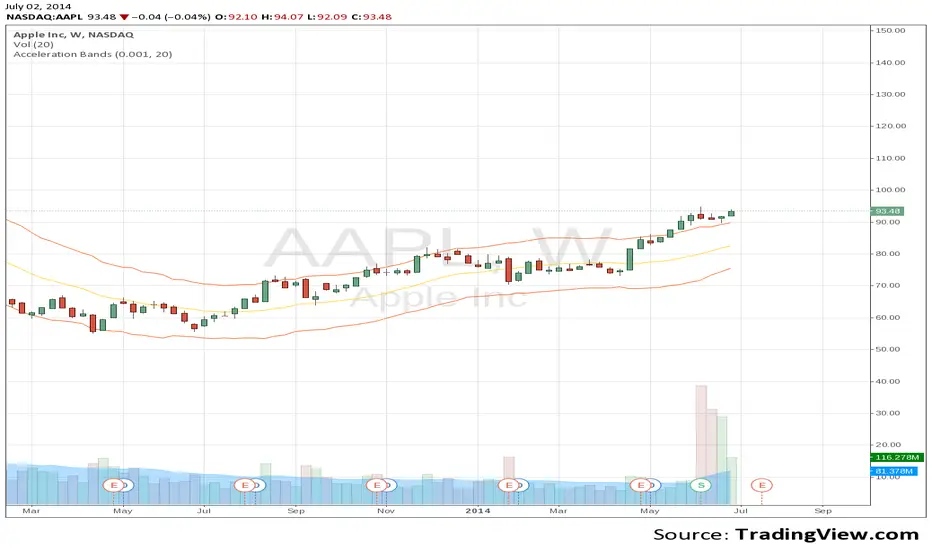
Acceleration BandsPrice Headley\'s Acceleration Bands serve as a trading envelope that factor in a stock\'s typical volatility over standard settings of 20 or 80 bars. They can be used across any time frame, though Headley prefers to use them most across weekly and monthly timeframes as breakout indicators outside these bands, while using the shorter time frames to define likely support and resistance levels at the lower and upper Acceleration Bands. Acceleration Bands are plotted around a simple moving average as the midpoint, and the upper and lower bands are of equal distance from this midpoint.
www.swingtracker.com
forex-indicators.net
Indicator: Price Headley Accelaration Bands [LazyBear]The Acceleration Band System was published in "Big Trends in Trading" by Price Headley in 2002. The system designed to catch stocks as they start to trend but before they go parabolic. The system is simple but supposed to be very effective.
This system makes use of %R and ADX a lot to determine the entries/exits. Refer to the documents listed below for the complete set of rules.
More info:
* System Trading Rules: drive.google.com
* www.bigtrends.com
* www.slideshare.net

Indicators: Hurst Bands and Hurst OscillatorThese 2 indicators are derivative work from Jim Hurst's book - "The Magic of Stock Transaction Timing".
The bands are % bands around a median that gets calculated according to Hurst's formula. The outer bands (called ExtremeBands) signify extreme overbought/oversold conditions. Inner bands signify potential pullback points. As you can see, they also act as dynamic S/R levels.
The oscillator bands match the bands overlaid on price, so you will get an excellent indication of where the price is gonna do by using the oscillator along with the bands. Note that Hurst Oscillator can be used separately too, there is no technical dependency on Hurst Bands.
More info on Hurst Method:
www.readtheticker.com
