OPEN-SOURCE SCRIPT
Actualizado RSI Triple Time Frame

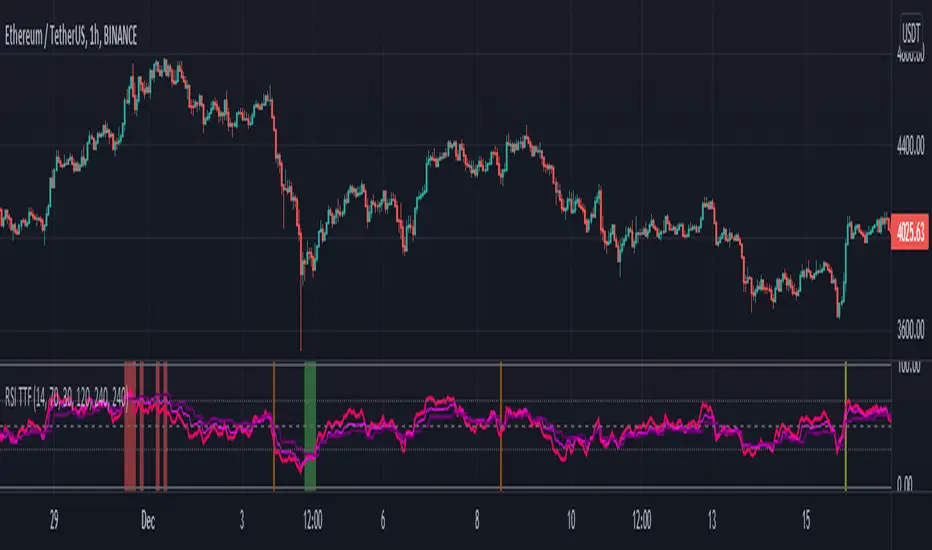
This indicator / study script can display the RSI for current chart timeframe along with the RSI of 1 to 3 other timeframes.
When all 3 additional RSI are at extreme levels (overbought/sold) or crossing the neutral line (50%) at the same moment, background chart color will change accordingly.
This indicates a strong momentum convergence between all selected timeframes, hence producing a stronger signal!
Go to settings to display/modify additional timeframes and/or to enable background colors:
Green = Overbought
Red = Oversold
Yellow = crossover neutral
Orange = crossunder neutral
NB1: For a simple and easy read of the RSI, set all additional TF to current chart TF and switch on desired colors.
NB2: Please note that current chart TF is not taken into consideration to change background color. But you can always set one of the 3 additional TF to the same TF as current chart.
Bonus: If you are also a user of my “MA Bollinger Bands + RSI” strategy script, this is particularly useful to visually detect crossover and crossunder of the RSI neutral line 😉
As always, enjoy!
Notas de prensa
Neutral Line, previsouly hard coded at 50, now has it's own user input.Notas de prensa
- [Upadted to Pine V5]
[Color changes between possible max & min values]
[Cleaner input settings]
Notas de prensa
- Upadted to Pine V5
- Color changes between possible max & min values
- Cleaner input settings
Notas de prensa
V5- Fixed the 3 "Higher Time Frame RSIs" repainting issues.
Script de código abierto
Fiel al espíritu de TradingView, el creador de este script lo ha convertido en código abierto, para que los traders puedan revisar y verificar su funcionalidad. ¡Enhorabuena al autor! Aunque puede utilizarlo de forma gratuita, recuerde que la republicación del código está sujeta a nuestras Normas internas.
Exención de responsabilidad
La información y las publicaciones no constituyen, ni deben considerarse como asesoramiento o recomendaciones financieras, de inversión, de trading o de otro tipo proporcionadas o respaldadas por TradingView. Más información en Condiciones de uso.