OPEN-SOURCE SCRIPT
Actualizado Support & Resistance Parser
I've created a user-friendly trading indicator that interprets and visually presents support and resistance levels, transforming raw data into actionable insights.
Here's a glimpse of what you might encounter:
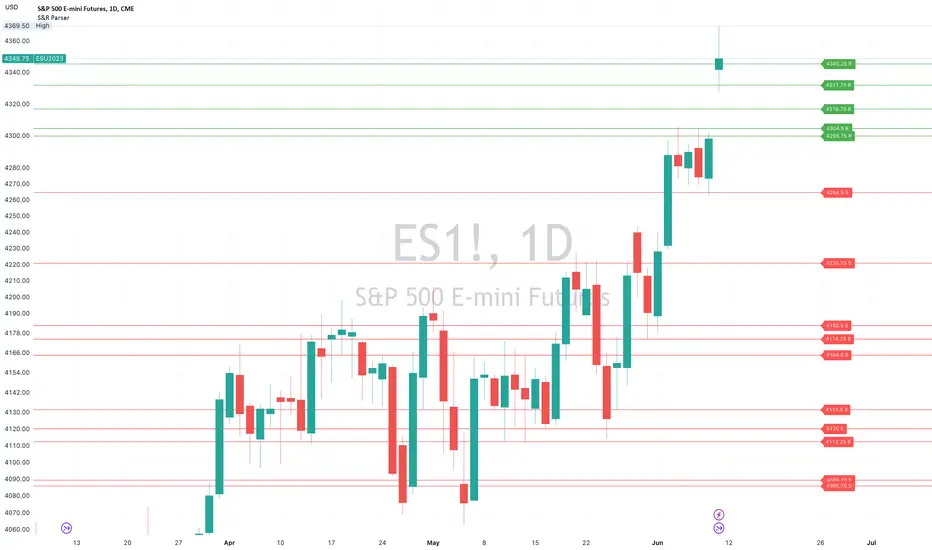
Today's trigger points (ES)
Support: 4264.5,4220.75,4131.5,4164.5,3980.75,4182.5,4174.25,4120,4112.25,4089.25,4085.75
Resistance: 4299.75,4304.5,4316.75,4345.25,4331.75
This is how it works:
1. Copy the series of support and resistance figures, ie just the comma separated numbers
2. Paste each series into their respective setting in the indicator.
3. The indicator parses the data, understanding the sequence and importance of each figure.
4. It then draws the corresponding support and resistance lines on your trading chart.
Chart would appear similar to the following:

This tool distinguishes itself with its user-friendly features. Each line comes with adjustable labels, enabling users to personalize their visualization. This makes the data more intuitive and easier to comprehend, enhancing decision-making during trades.
Note: The indicator includes limited error handling capabilities.
Make the most out of your trading journey with this intuitive and customizable tool, specifically designed to turn raw data into valuable trading insights.
Here's a glimpse of what you might encounter:
Today's trigger points (ES)
Support: 4264.5,4220.75,4131.5,4164.5,3980.75,4182.5,4174.25,4120,4112.25,4089.25,4085.75
Resistance: 4299.75,4304.5,4316.75,4345.25,4331.75
This is how it works:
1. Copy the series of support and resistance figures, ie just the comma separated numbers
2. Paste each series into their respective setting in the indicator.
3. The indicator parses the data, understanding the sequence and importance of each figure.
4. It then draws the corresponding support and resistance lines on your trading chart.
Chart would appear similar to the following:
This tool distinguishes itself with its user-friendly features. Each line comes with adjustable labels, enabling users to personalize their visualization. This makes the data more intuitive and easier to comprehend, enhancing decision-making during trades.
Note: The indicator includes limited error handling capabilities.
Make the most out of your trading journey with this intuitive and customizable tool, specifically designed to turn raw data into valuable trading insights.
Notas de prensa
Updating ChartScript de código abierto
Fiel al espíritu de TradingView, el creador de este script lo ha convertido en código abierto, para que los traders puedan revisar y verificar su funcionalidad. ¡Enhorabuena al autor! Aunque puede utilizarlo de forma gratuita, recuerde que la republicación del código está sujeta a nuestras Normas internas.
Exención de responsabilidad
La información y las publicaciones no constituyen, ni deben considerarse como asesoramiento o recomendaciones financieras, de inversión, de trading o de otro tipo proporcionadas o respaldadas por TradingView. Más información en Condiciones de uso.
Script de código abierto
Fiel al espíritu de TradingView, el creador de este script lo ha convertido en código abierto, para que los traders puedan revisar y verificar su funcionalidad. ¡Enhorabuena al autor! Aunque puede utilizarlo de forma gratuita, recuerde que la republicación del código está sujeta a nuestras Normas internas.
Exención de responsabilidad
La información y las publicaciones no constituyen, ni deben considerarse como asesoramiento o recomendaciones financieras, de inversión, de trading o de otro tipo proporcionadas o respaldadas por TradingView. Más información en Condiciones de uso.