OPEN-SOURCE SCRIPT
Optimized Logarithmic Curve for Bitcoin (BTC/USD) by FICAS
Hello everyone!
I'd like to share with you a handy tool that is incredibly useful for analyzing Bitcoin's price movements. This optimized logarithmic curve indicator is a refined version of the popular "My BTC log curve" indicator, originally created by @quantadelic.
We have made several improvements to enhance its predictive capabilities when it comes to identifying potential price bottoms for Bitcoin BTC/USD.
Description:
In this detailed analysis, we are excited to introduce you to an optimized version of the popular "My BTC log curve" indicator, originally created by @quantadelic. We have refined the indicator for enhanced predictive capabilities when it comes to identifying potential price bottoms for Bitcoin BTC/USD. By putting ourselves in the reader's shoes, we aim to provide a comprehensive and meaningful explanation of our analysis and predictions using this improved tool.
The logarithmic curve is a powerful tool for analyzing price movements in a non-linear fashion, allowing traders and investors to identify critical turning points and trends. With the optimized logarithmic curve, we can more accurately predict potential price bottoms, ultimately guiding better-informed trading and investment decisions.
Key Features of the Optimized Logarithmic Curve:
Improved predictive capabilities: The refined logarithmic curve has been optimized to provide more accurate predictions of potential price bottoms, enabling traders to make better-informed decisions.
Enhanced visualization: The optimized curve offers a clearer visual representation of Bitcoin's price movements, making it easier for traders to identify patterns and trends.
Adaptability: This indicator can be applied to various timeframes, providing insights for both short-term and long-term traders.
The optimized logarithmic curve indicator is based on a logarithmic regression of the USD price of Bitcoin, calculated according to the equation:
y = A * exp(beta * x^lambda + c) + m * x + b
where x is the number of days since the genesis block. All parameters are editable in the script options, allowing traders to customize the curve to their preferences.
Here are some of the key changes made to the original indicator to create the optimized logarithmic curve:
Midline Calculation: The optimized logarithmic curve utilizes an updated method for calculating the midline, which better represents the average price movement of Bitcoin over time. This improved midline calculation provides a more accurate representation of Bitcoin's historical price trajectory, making it easier to identify potential price bottoms.
Cross Line Calculation: We have modified the way cross lines are calculated in the optimized logarithmic curve. These new cross lines are derived from a combination of the updated midline calculation and historical support and resistance levels. This change allows traders to more accurately identify critical points in the market where price action is likely to reverse or continue its trend.
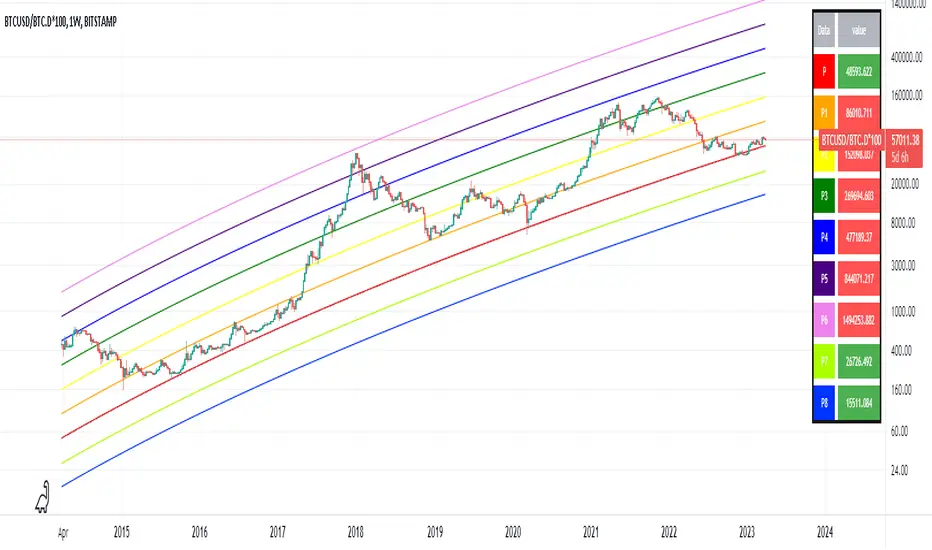
Table Display: a powerful visualization tool designed to provide a comprehensive overview of the relationships between various exponential curves and the Bitcoin price. This table display, integrated into the "FiCAS BTC log curve" indicator, enables traders and analysts to quickly compare and assess the impact of these curves on the market.
Our analysis using the optimized logarithmic curve suggests that Bitcoin might be at a critical price bottom, indicating that selling at this point may not be the most prudent course of action. Instead, traders and investors could consider taking advantage of the potential upswing as the market moves away from the identified price bottom.
Key highlights of this Optimized Logarithmic Curve for Bitcoin (BTC/USD) by FICAS:
Custom Pine Script: Pinescript code serves as the backbone of this strategy, providing a strong foundation for identifying potential opportunities based on the relationships between exponential curves and Bitcoin price.
MACD Indicator: The Moving Average Convergence Divergence (MACD) is integrated to help traders recognize trend reversals, bullish or bearish market conditions, and potential entry or exit points.
Momentum Indicator: By incorporating the Momentum (10, close) indicator, traders can identify the strength of price movements and potential trend continuations or reversals.
RSI and SMA: The Relative Strength Index (RSI) is used to assess overbought or oversold conditions, while the Simple Moving Average (SMA) with a period of 14 and an applied factor of 2 smoothens the data for better trend identification.
IMPORTANT:
While this indicator can be applied to traditional BTC/USD charts, we highly recommend using it on the following chart for optimal results in identifying price bottoms:
BITSTAMP:BTCUSD / CRYPTOCAP:BTC.D * 100
By employing the optimized logarithmic curve indicator on the recommended chart, traders can gain a more accurate perspective on potential price bottoms, leading to improved decision-making.
In conclusion, the optimized logarithmic curve indicator provides valuable insights into Bitcoin's price movements, allowing traders and investors to make more informed decisions. We encourage you to test this refined tool and share your thoughts in the comments section. Special thanks to quantadelic, the first creator of this indicator, for inspiring us to develop this optimized version. If you have any questions or require further clarification, please feel free to ask. Wishing you success in your trading and investment endeavors!
Please ensure you understand and abide by the TradingView House Rules when using this indicator: tradingview.com/house-rules
I'd like to share with you a handy tool that is incredibly useful for analyzing Bitcoin's price movements. This optimized logarithmic curve indicator is a refined version of the popular "My BTC log curve" indicator, originally created by @quantadelic.
We have made several improvements to enhance its predictive capabilities when it comes to identifying potential price bottoms for Bitcoin BTC/USD.
Description:
In this detailed analysis, we are excited to introduce you to an optimized version of the popular "My BTC log curve" indicator, originally created by @quantadelic. We have refined the indicator for enhanced predictive capabilities when it comes to identifying potential price bottoms for Bitcoin BTC/USD. By putting ourselves in the reader's shoes, we aim to provide a comprehensive and meaningful explanation of our analysis and predictions using this improved tool.
The logarithmic curve is a powerful tool for analyzing price movements in a non-linear fashion, allowing traders and investors to identify critical turning points and trends. With the optimized logarithmic curve, we can more accurately predict potential price bottoms, ultimately guiding better-informed trading and investment decisions.
Key Features of the Optimized Logarithmic Curve:
Improved predictive capabilities: The refined logarithmic curve has been optimized to provide more accurate predictions of potential price bottoms, enabling traders to make better-informed decisions.
Enhanced visualization: The optimized curve offers a clearer visual representation of Bitcoin's price movements, making it easier for traders to identify patterns and trends.
Adaptability: This indicator can be applied to various timeframes, providing insights for both short-term and long-term traders.
The optimized logarithmic curve indicator is based on a logarithmic regression of the USD price of Bitcoin, calculated according to the equation:
y = A * exp(beta * x^lambda + c) + m * x + b
where x is the number of days since the genesis block. All parameters are editable in the script options, allowing traders to customize the curve to their preferences.
Here are some of the key changes made to the original indicator to create the optimized logarithmic curve:
Midline Calculation: The optimized logarithmic curve utilizes an updated method for calculating the midline, which better represents the average price movement of Bitcoin over time. This improved midline calculation provides a more accurate representation of Bitcoin's historical price trajectory, making it easier to identify potential price bottoms.
Cross Line Calculation: We have modified the way cross lines are calculated in the optimized logarithmic curve. These new cross lines are derived from a combination of the updated midline calculation and historical support and resistance levels. This change allows traders to more accurately identify critical points in the market where price action is likely to reverse or continue its trend.
Table Display: a powerful visualization tool designed to provide a comprehensive overview of the relationships between various exponential curves and the Bitcoin price. This table display, integrated into the "FiCAS BTC log curve" indicator, enables traders and analysts to quickly compare and assess the impact of these curves on the market.
Our analysis using the optimized logarithmic curve suggests that Bitcoin might be at a critical price bottom, indicating that selling at this point may not be the most prudent course of action. Instead, traders and investors could consider taking advantage of the potential upswing as the market moves away from the identified price bottom.
Key highlights of this Optimized Logarithmic Curve for Bitcoin (BTC/USD) by FICAS:
Custom Pine Script: Pinescript code serves as the backbone of this strategy, providing a strong foundation for identifying potential opportunities based on the relationships between exponential curves and Bitcoin price.
MACD Indicator: The Moving Average Convergence Divergence (MACD) is integrated to help traders recognize trend reversals, bullish or bearish market conditions, and potential entry or exit points.
Momentum Indicator: By incorporating the Momentum (10, close) indicator, traders can identify the strength of price movements and potential trend continuations or reversals.
RSI and SMA: The Relative Strength Index (RSI) is used to assess overbought or oversold conditions, while the Simple Moving Average (SMA) with a period of 14 and an applied factor of 2 smoothens the data for better trend identification.
IMPORTANT:
While this indicator can be applied to traditional BTC/USD charts, we highly recommend using it on the following chart for optimal results in identifying price bottoms:
BITSTAMP:BTCUSD / CRYPTOCAP:BTC.D * 100
By employing the optimized logarithmic curve indicator on the recommended chart, traders can gain a more accurate perspective on potential price bottoms, leading to improved decision-making.
In conclusion, the optimized logarithmic curve indicator provides valuable insights into Bitcoin's price movements, allowing traders and investors to make more informed decisions. We encourage you to test this refined tool and share your thoughts in the comments section. Special thanks to quantadelic, the first creator of this indicator, for inspiring us to develop this optimized version. If you have any questions or require further clarification, please feel free to ask. Wishing you success in your trading and investment endeavors!
Please ensure you understand and abide by the TradingView House Rules when using this indicator: tradingview.com/house-rules
Script de código abierto
Fiel al espíritu de TradingView, el creador de este script lo ha convertido en código abierto, para que los traders puedan revisar y verificar su funcionalidad. ¡Enhorabuena al autor! Aunque puede utilizarlo de forma gratuita, recuerde que la republicación del código está sujeta a nuestras Normas internas.
Exención de responsabilidad
La información y las publicaciones no constituyen, ni deben considerarse como asesoramiento o recomendaciones financieras, de inversión, de trading o de otro tipo proporcionadas o respaldadas por TradingView. Más información en Condiciones de uso.