OPEN-SOURCE SCRIPT
Actualizado Laguerre RSI Multi-Time Frame
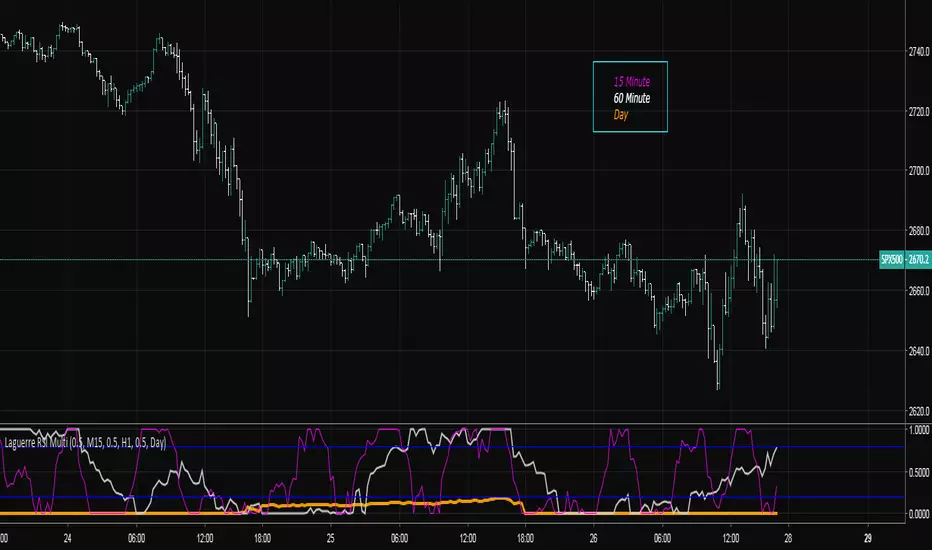
The Laguerre RSI Indicator is a modification of the well-known relative strength indicator or RSI. John F. Ehlers, the famous trader who created the Laguerre RSI, tried to avoid whipsaws (noise) and lag produced by smoothing technical indicators by applying a filter and some changes to the original relative strength indicator. The result is a technical indicator that is more responsive and has much less noise than the original RSI indicator.
The multi-time frame LRSI is used to have multiple RSI oscillators on the screen at once that are derived from different intervals. This allows the trader to see setups in multiple time frames.
The multi-time frame LRSI is used to have multiple RSI oscillators on the screen at once that are derived from different intervals. This allows the trader to see setups in multiple time frames.
Notas de prensa
Updated to Version 3 compatibility.Notas de prensa
Updated to version 3 and fixed defaults.Notas de prensa
- Fixed repainting issues. Desired intervals greater than the chart interval will now show incremental updates. Let me know through the comments section if it is desired to add smoothing to help with the noise that is generated because of this.
- Added option to lock each of the intervals onto the chart interval to enable easy flipping between chart intervals and have each LRSI update accordingly.
Notas de prensa
Fixed session security function call, forget that it needs the lookahead flag added for version 3. i.e.- start = security(tickerid, rez, time, lookahead = true)
Notas de prensa
Changed the main script window TF to 15m, updates complete for this cycle. Script de código abierto
Fiel al espíritu de TradingView, el creador de este script lo ha convertido en código abierto, para que los traders puedan revisar y verificar su funcionalidad. ¡Enhorabuena al autor! Aunque puede utilizarlo de forma gratuita, recuerde que la republicación del código está sujeta a nuestras Normas internas.
Find the edge.
Website: daily-edge.com
Twitter: twitter.com/dailyEdgeGroup
Youtube: youtube.com/c/TheDailyEdgeTradingGroup
Telegram: t.me/mortdiggiddy
Paypal: paypal.me/mortdiggiddy
Website: daily-edge.com
Twitter: twitter.com/dailyEdgeGroup
Youtube: youtube.com/c/TheDailyEdgeTradingGroup
Telegram: t.me/mortdiggiddy
Paypal: paypal.me/mortdiggiddy
Exención de responsabilidad
La información y las publicaciones no constituyen, ni deben considerarse como asesoramiento o recomendaciones financieras, de inversión, de trading o de otro tipo proporcionadas o respaldadas por TradingView. Más información en Condiciones de uso.
Script de código abierto
Fiel al espíritu de TradingView, el creador de este script lo ha convertido en código abierto, para que los traders puedan revisar y verificar su funcionalidad. ¡Enhorabuena al autor! Aunque puede utilizarlo de forma gratuita, recuerde que la republicación del código está sujeta a nuestras Normas internas.
Find the edge.
Website: daily-edge.com
Twitter: twitter.com/dailyEdgeGroup
Youtube: youtube.com/c/TheDailyEdgeTradingGroup
Telegram: t.me/mortdiggiddy
Paypal: paypal.me/mortdiggiddy
Website: daily-edge.com
Twitter: twitter.com/dailyEdgeGroup
Youtube: youtube.com/c/TheDailyEdgeTradingGroup
Telegram: t.me/mortdiggiddy
Paypal: paypal.me/mortdiggiddy
Exención de responsabilidad
La información y las publicaciones no constituyen, ni deben considerarse como asesoramiento o recomendaciones financieras, de inversión, de trading o de otro tipo proporcionadas o respaldadas por TradingView. Más información en Condiciones de uso.