OPEN-SOURCE SCRIPT
Actualizado Stock to Flow Model with Standard Deviation Bands
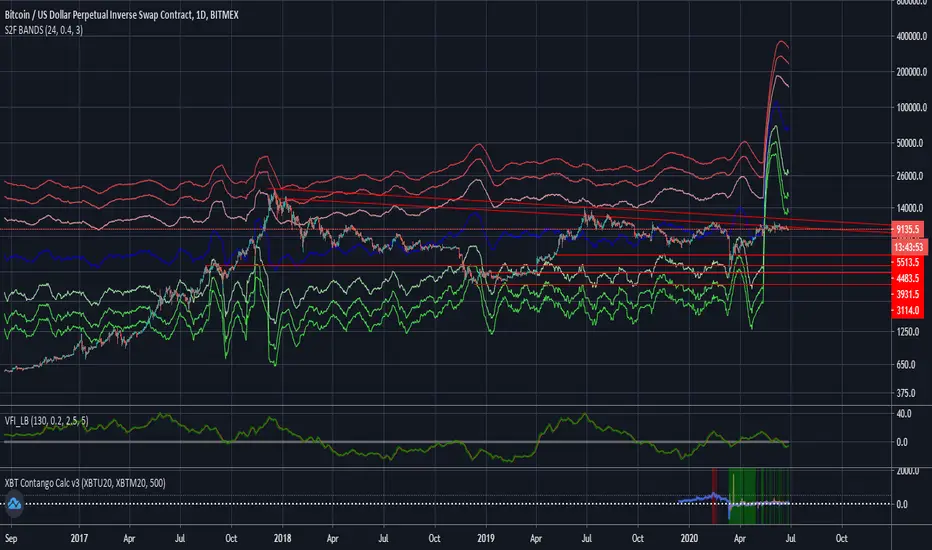
This Study takes the Stock to Flow Model for Bitcoin as presented by 100trillionUSD and smoothes it using an SMA. Then it calculates the close's standard deviation from it and displays the 2-Sigma Bands.
The stock to flow model seems to be one of the best predictions of Bitcoins price.
The standard deviation bands are supposed to show situations in which Bitcoin is significantly over- or under-bought.
The stock to flow model seems to be one of the best predictions of Bitcoins price.
The standard deviation bands are supposed to show situations in which Bitcoin is significantly over- or under-bought.
Notas de prensa
Added option to change the standard stock to flow model values.Script de código abierto
Fiel al espíritu de TradingView, el creador de este script lo ha convertido en código abierto, para que los traders puedan revisar y verificar su funcionalidad. ¡Enhorabuena al autor! Aunque puede utilizarlo de forma gratuita, recuerde que la republicación del código está sujeta a nuestras Normas internas.
Exención de responsabilidad
La información y las publicaciones no constituyen, ni deben considerarse como asesoramiento o recomendaciones financieras, de inversión, de trading o de otro tipo proporcionadas o respaldadas por TradingView. Más información en Condiciones de uso.
Script de código abierto
Fiel al espíritu de TradingView, el creador de este script lo ha convertido en código abierto, para que los traders puedan revisar y verificar su funcionalidad. ¡Enhorabuena al autor! Aunque puede utilizarlo de forma gratuita, recuerde que la republicación del código está sujeta a nuestras Normas internas.
Exención de responsabilidad
La información y las publicaciones no constituyen, ni deben considerarse como asesoramiento o recomendaciones financieras, de inversión, de trading o de otro tipo proporcionadas o respaldadas por TradingView. Más información en Condiciones de uso.