OPEN-SOURCE SCRIPT
Garman-Klass-Yang-Zhang Volatility Estimator
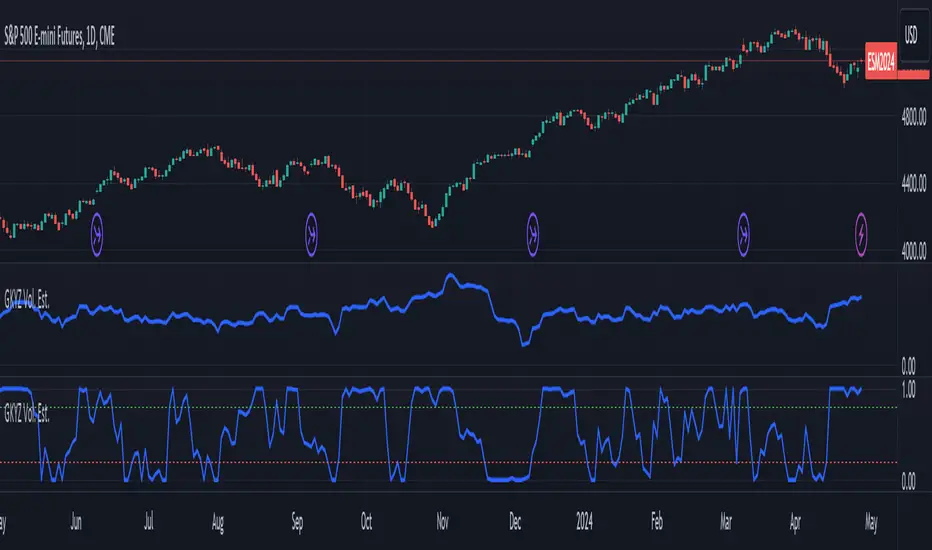
The Garman-Klass-Yang-Zhang Volatility Estimator (GKYZVE) is yet another attempt to robustly measure volatility, integrating intra-candle and inter-candle dynamics. It is an extension of the Garman-Klass Volatility Estimator (GKVE) incorporating insights from the Yang-Zhang Volatility Estimator (YZVE). Like the YZVE, the GKYZVE holistically considers open, high, low, and close prices. The formula for GKYZ is:
GKYZVE = 0.5 * σ_HL² + [(2 * math.log(2) -1)] * σ_CC² + σ_OC²
Where:
The GKYZVE differs from the YZVE by using fixed weighing factors derived from theoretical calculations, leaning heavier into the assumption that returns are log-distributed.
This script also offers a choice for normalization between 0 and 1, turning the estimator into an oscillator for comparing current volatility to recent levels. Horizontal lines at user-defined levels are also available for clearer visualization. Both options are off by default.
References:
Garman, M. B., & Klass, M. J. (1980). On the estimation of security price volatilities from historical data. The Journal of Business, 53(1), 67-78.
Yang, D., & Zhang, Q. (2000). Drift-independent volatility estimation based on high, low, open, and close prices. The Journal of Business, 73(3), 477-492.
GKYZVE = 0.5 * σ_HL² + [(2 * math.log(2) -1)] * σ_CC² + σ_OC²
Where:
- σ_HL² is the variance based on the high and low prices (σ_HL² = (high - low)² / (4 * math.log(2))), weighted at 0.5.
- σ_CC² is the close-to-close variance (σ_CC² = (close[1] - close)²), weighted at (2 ln 2) -1 for the logarithmic distribution of returns and emphasizing the impact of day-to-day price changes.
- σ_OC² is the variance of the opening price against the closing price (σ_OC² = 0.5 * (open - close)²), weighted at 1.
The GKYZVE differs from the YZVE by using fixed weighing factors derived from theoretical calculations, leaning heavier into the assumption that returns are log-distributed.
This script also offers a choice for normalization between 0 and 1, turning the estimator into an oscillator for comparing current volatility to recent levels. Horizontal lines at user-defined levels are also available for clearer visualization. Both options are off by default.
References:
Garman, M. B., & Klass, M. J. (1980). On the estimation of security price volatilities from historical data. The Journal of Business, 53(1), 67-78.
Yang, D., & Zhang, Q. (2000). Drift-independent volatility estimation based on high, low, open, and close prices. The Journal of Business, 73(3), 477-492.
Script de código abierto
Fiel al espíritu de TradingView, el creador de este script lo ha convertido en código abierto, para que los traders puedan revisar y verificar su funcionalidad. ¡Enhorabuena al autor! Aunque puede utilizarlo de forma gratuita, recuerde que la republicación del código está sujeta a nuestras Normas internas.
Exención de responsabilidad
La información y las publicaciones no constituyen, ni deben considerarse como asesoramiento o recomendaciones financieras, de inversión, de trading o de otro tipo proporcionadas o respaldadas por TradingView. Más información en Condiciones de uso.