OPEN-SOURCE SCRIPT
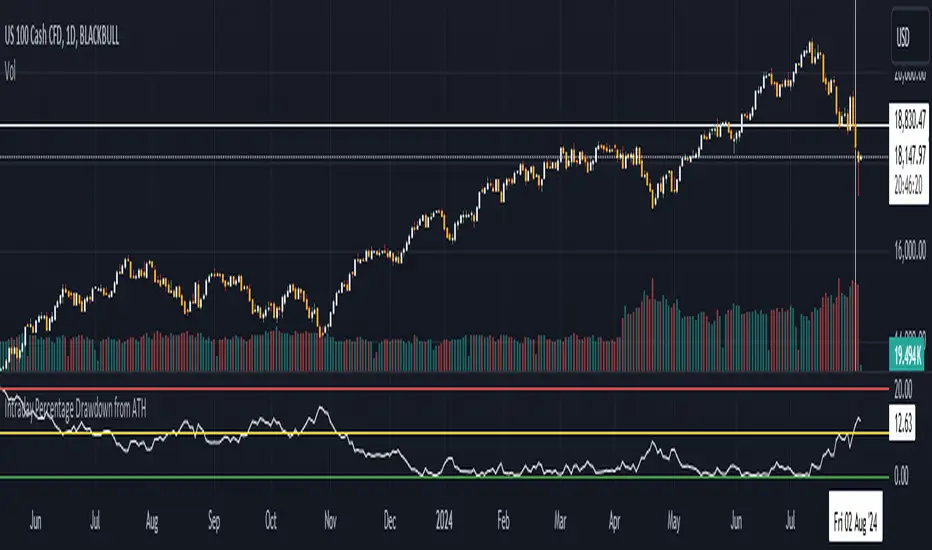
Intraday Percentage Drawdown from ATH
Track Intraday ATH:
The script maintains an intradayATH variable to track the highest price reached during the trading day up to the current point.
This variable is updated whenever a new high is reached.
Calculate Drawdown and Percentage Drawdown:
The drawdown is calculated as the difference between the intradayATH and the current closing price (close).
The percentage drawdown is calculated by dividing the drawdown by the intradayATH and multiplying by 100.
Plot Percentage Drawdown:
The percentageDrawdown is plotted on the chart with a red line to visually represent the drawdown from the intraday all-time high.
Draw Recession Line:
A horizontal red line is drawn at the 20.00 level, labeled "Recession". The line is styled as dotted and has a width of 2 for better visibility.
Draw Correction Line:
A horizontal yellow line is drawn at the 10.00 level, labeled "Correction". The line is styled as dotted and has a width of 2 for better visibility.
Draw All Time High Line:
A horizontal green line is drawn at the 0.0 level to represent the all-time high, labeled "All Time High". The line is styled as dotted and has a width of 2 for better visibility.
This script will display the percentage drawdown along with reference lines at 20% (recession), 10% (correction), and 0% (all-time high).
Script de código abierto
Fiel al espíritu de TradingView, el creador de este script lo ha convertido en código abierto, para que los traders puedan revisar y verificar su funcionalidad. ¡Enhorabuena al autor! Aunque puede utilizarlo de forma gratuita, recuerde que la republicación del código está sujeta a nuestras Normas internas.
Exención de responsabilidad
La información y las publicaciones no constituyen, ni deben considerarse como asesoramiento o recomendaciones financieras, de inversión, de trading o de otro tipo proporcionadas o respaldadas por TradingView. Más información en Condiciones de uso.