OPEN-SOURCE SCRIPT
Actualizado level_stats
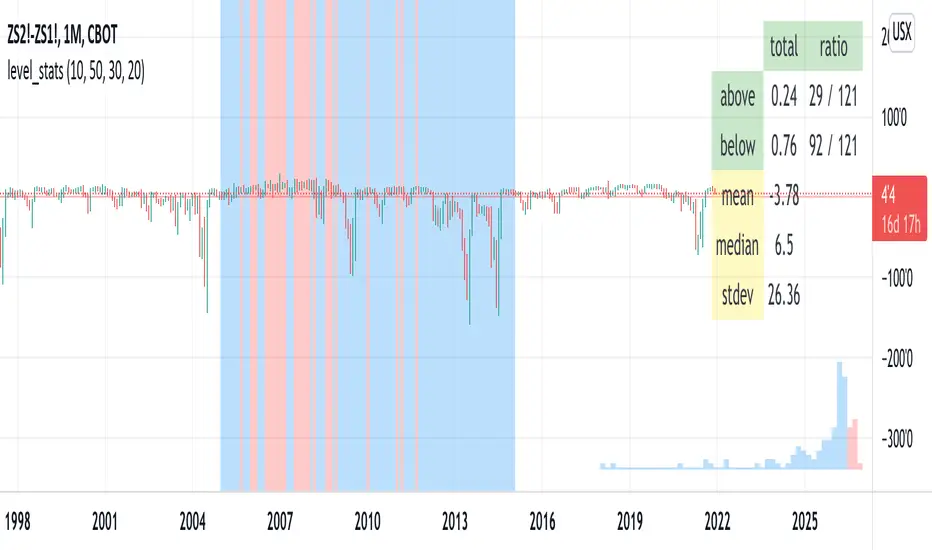
This script tells you the percentage of time an instrument's closing value is above and below a level of your choosing. The background color visually indicates periods where the instrument closed at or above the level (red) and below it (blue). For "stationary-ish" processes, you can get a loose feel for the mean, high, and low values. The historical information conveyed through the background coloring can help you plan derivatives trades. Try with your favorite pairs, commodities, or volatility indices.
Usage: pick a level of interest using the input.
Usage: pick a level of interest using the input.
Notas de prensa
Added a histogram to depict the distribution of closing prices. Prices less than the "level" input are blue, while those above the level are red. This color scheme is also used to color the chart background.Notas de prensa
removed some debug codeNotas de prensa
added mean, median, and stdevNotas de prensa
Added a date selection. The statistics and histogram will reflect only the period [ start, end ).Notas de prensa
added a horizontal line (light red) to indicate the levelNotas de prensa
The histogram's width, height, and number of buckets are now adjustable inputs. More buckets will make the histogram somewhat smoother and more detailed, but at the cost of performance. The maximum number of buckets is probably around 80. The width and height units are "percentage of the screen".I have set the defaults at levels that perform reasonably well.
Script de código abierto
Fiel al espíritu de TradingView, el creador de este script lo ha convertido en código abierto, para que los traders puedan revisar y verificar su funcionalidad. ¡Enhorabuena al autor! Aunque puede utilizarlo de forma gratuita, recuerde que la republicación del código está sujeta a nuestras Normas internas.
Exención de responsabilidad
La información y las publicaciones no constituyen, ni deben considerarse como asesoramiento o recomendaciones financieras, de inversión, de trading o de otro tipo proporcionadas o respaldadas por TradingView. Más información en Condiciones de uso.