OPEN-SOURCE SCRIPT
Coral Trend of BiznesFilosof
Actualizado
This indicator is made specifically for day trading. You can trade within the day, but then you need to change the settings for your strategy.
You can enter a trade when the schedule returns to the corridor. But be sure to pay attention to the Bill Williams indicator "Alligator".
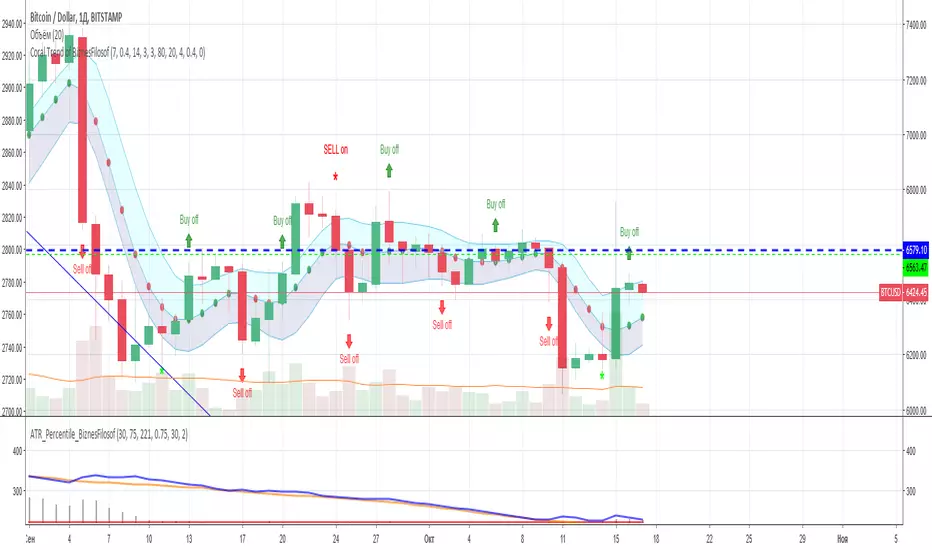
Everything is simple here: red dots are a sales trend, and green dots are a shopping trend.
For convenience, candles can be moved to the last layer.
More details on my channel in YouTube. Section "Indicators".
===
Этот индикатор сделан специально для дневной торговли. Можно торговать и внутри дня, но тогда надо изменить настройки под Вашу стратегию.
Входить в сделку можно, когда график возвращается в коридор. Но обязательно нужно обращать внимание на индикатор Билла Вильямса "Аллигатор".
Здесь всё просто: красные точки - тренд продаж, а зеленые точки - тренд покупок.
Для удобства свечи можно переместить на последний слой.
Больше подробностей на моём канале в Ютуб. Раздел "Индикаторы".
You can enter a trade when the schedule returns to the corridor. But be sure to pay attention to the Bill Williams indicator "Alligator".
Everything is simple here: red dots are a sales trend, and green dots are a shopping trend.
For convenience, candles can be moved to the last layer.
More details on my channel in YouTube. Section "Indicators".
===
Этот индикатор сделан специально для дневной торговли. Можно торговать и внутри дня, но тогда надо изменить настройки под Вашу стратегию.
Входить в сделку можно, когда график возвращается в коридор. Но обязательно нужно обращать внимание на индикатор Билла Вильямса "Аллигатор".
Здесь всё просто: красные точки - тренд продаж, а зеленые точки - тренд покупок.
Для удобства свечи можно переместить на последний слой.
Больше подробностей на моём канале в Ютуб. Раздел "Индикаторы".
Notas de prensa
I decided to improve the accuracy of the indicator, to find the entry point, and added Stochastic analysis. These are "BUY" and "SELL" with a "*" sign based on the analysis.===
Решил улучшить точность индикатора, для нахождения точки входа, и добавил анализ Stochastic. Это "BUY" и "SELL" со знаком "*" на базе анализа.
Notas de prensa
It was necessary to show the opening and closing of orders, like “on” and “off”, in order to set more clarity in the indicator.===
Пришлось показать открытие и закрытие ордеров, как «on» и «off», чтобы установить больше ясности в индикатор.
Script de código abierto
Siguiendo fielmente el espíritu de TradingView, el autor de este script lo ha publicado en código abierto, permitiendo que otros traders puedan entenderlo y verificarlo. ¡Olé por el autor! Puede utilizarlo de forma gratuita, pero tenga en cuenta que la reutilización de este código en la publicación se rige por las Normas internas. Puede añadir este script a sus favoritos y usarlo en un gráfico.
¿Quiere utilizar este script en un gráfico?
Exención de responsabilidad
La información y las publicaciones que ofrecemos, no implican ni constituyen un asesoramiento financiero, ni de inversión, trading o cualquier otro tipo de consejo o recomendación emitida o respaldada por TradingView. Puede obtener información adicional en las Condiciones de uso.