PROTECTED SOURCE SCRIPT
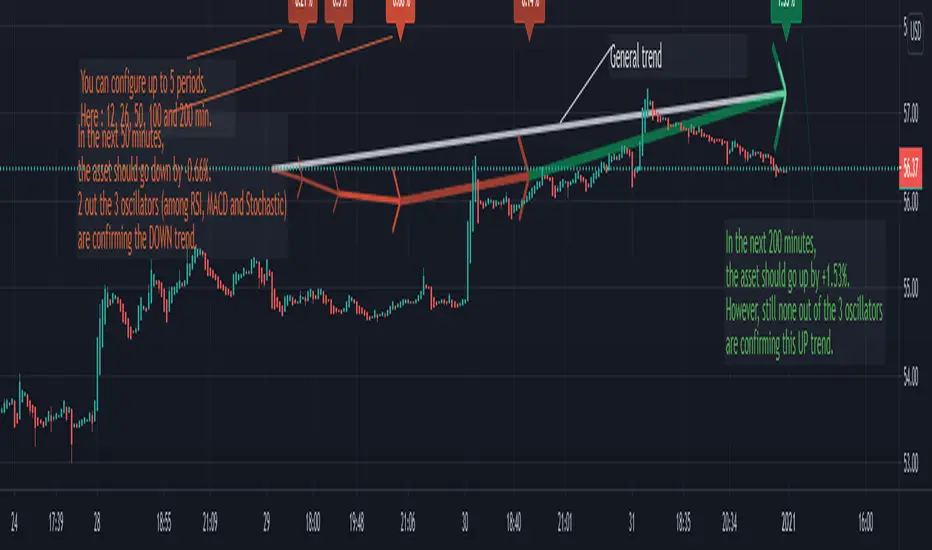
Different Resolutions Trender

This script aims at giving the quickest insight over different time resolutions and their relative trends.
The graph is updated on every new bar.
5 periods of time can be configured with each their own signal periods.
For each period, you get an insight on:
- its general movement in comparison the latest close (green: up / red: down)
- its length (ex: 50 minutes)
- its movement (ex: -0.66%)
- its probability (ex: 2 out of 3 oscillators confirming the trend)
[To be improved]
I would be happy to add any useful content on this.
Especially being able to offset this predictive general trend to the right on the last bar, which I do not think is feasible on Pine so far.
Script protegido
Este script se publica como código cerrado. No obstante, puede utilizarlo libremente y sin ninguna limitación. Obtenga más información aquí.
Exención de responsabilidad
La información y las publicaciones no constituyen, ni deben considerarse como asesoramiento o recomendaciones financieras, de inversión, de trading o de otro tipo proporcionadas o respaldadas por TradingView. Más información en Condiciones de uso.