OPEN-SOURCE SCRIPT
Information Entropy Oscillator

Hello Traders
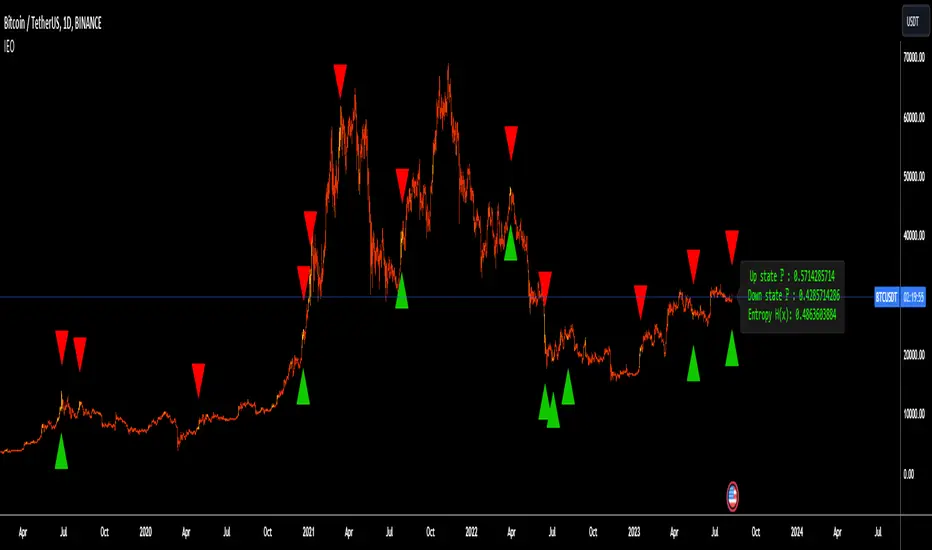
This Trading Indicator / script is my interpritation of the use of shannons entropy in Trading, hope you find this usefull !!!
Information Entropy Oscillator :
In Physics, entropy is a concept and a measurable physical property that is most commonly associated with the state of disorder, randomness or uncertainty of a system. In the Thermodynamic field Entropy also describes how much energy is not available to do work, The more disordered a system and higher the entropy, the less of a system's energy is available to do work. This last definition is central to the idea of this trading idea, Briefly this is because the lower the information Entropy the “more predictable” is price movement which is characterized by a two states process up(h), and down(d) - (green and red candles), thus the more predictable a up or down move, Given the definition this also means more “energy” which can be thought of as the systems “predictive power” is available to do work, where work in this case to predict the likelihood of a trend continuation.
In Information Theory, the entropy of a random variable (A statistical term that describes either a discrete or continuous event with a respective (discrete or continuous) probability, where the latter is expressed via a CDF - cumulative distribution function) is the average level of "information", "surprise", or "uncertainty" inherent to the variable's possible outcomes. note : this is the definition for Entropy that this script is built upon
Formual Derivation :

Interpretations of Information Entropy Values (Polar approach)
when , …
H(x) = 0 Max-Information gain (purity of knowledge available)
H(x) = 1 No INformation gain, When both states probabilities are equal, i.e. H = T = 0.5, the function yields maximum uncertainty and therefore maximum entropy. This reflects
When Information gain is nearing 0, thus low, the script attempts to predict the proceeding trend direction, for example when entropy is low and all bars preceding the real market / time bars have all been positive and the real time bar closes as a red candle (close < yesterday's open) the script takes this as a high information gain signal, “predicting” a Bearish trend.
The Script Also comes with a Information Entropy heat map to plot entropy (inspired by Oppenheimer and Barbie lol), to see this turn off all candle plots, plots in the Chart settings, under the symbol header .
This Trading Indicator / script is my interpritation of the use of shannons entropy in Trading, hope you find this usefull !!!
Information Entropy Oscillator :
In Physics, entropy is a concept and a measurable physical property that is most commonly associated with the state of disorder, randomness or uncertainty of a system. In the Thermodynamic field Entropy also describes how much energy is not available to do work, The more disordered a system and higher the entropy, the less of a system's energy is available to do work. This last definition is central to the idea of this trading idea, Briefly this is because the lower the information Entropy the “more predictable” is price movement which is characterized by a two states process up(h), and down(d) - (green and red candles), thus the more predictable a up or down move, Given the definition this also means more “energy” which can be thought of as the systems “predictive power” is available to do work, where work in this case to predict the likelihood of a trend continuation.
In Information Theory, the entropy of a random variable (A statistical term that describes either a discrete or continuous event with a respective (discrete or continuous) probability, where the latter is expressed via a CDF - cumulative distribution function) is the average level of "information", "surprise", or "uncertainty" inherent to the variable's possible outcomes. note : this is the definition for Entropy that this script is built upon
Formual Derivation :
Interpretations of Information Entropy Values (Polar approach)
when , …
H(x) = 0 Max-Information gain (purity of knowledge available)
H(x) = 1 No INformation gain, When both states probabilities are equal, i.e. H = T = 0.5, the function yields maximum uncertainty and therefore maximum entropy. This reflects
When Information gain is nearing 0, thus low, the script attempts to predict the proceeding trend direction, for example when entropy is low and all bars preceding the real market / time bars have all been positive and the real time bar closes as a red candle (close < yesterday's open) the script takes this as a high information gain signal, “predicting” a Bearish trend.
The Script Also comes with a Information Entropy heat map to plot entropy (inspired by Oppenheimer and Barbie lol), to see this turn off all candle plots, plots in the Chart settings, under the symbol header .
Script de código abierto
Fiel al espíritu de TradingView, el creador de este script lo ha convertido en código abierto, para que los traders puedan revisar y verificar su funcionalidad. ¡Enhorabuena al autor! Aunque puede utilizarlo de forma gratuita, recuerde que la republicación del código está sujeta a nuestras Normas internas.
Exención de responsabilidad
La información y las publicaciones no constituyen, ni deben considerarse como asesoramiento o recomendaciones financieras, de inversión, de trading o de otro tipo proporcionadas o respaldadas por TradingView. Más información en Condiciones de uso.