PROTECTED SOURCE SCRIPT
Actualizado GMS: The Oscillator
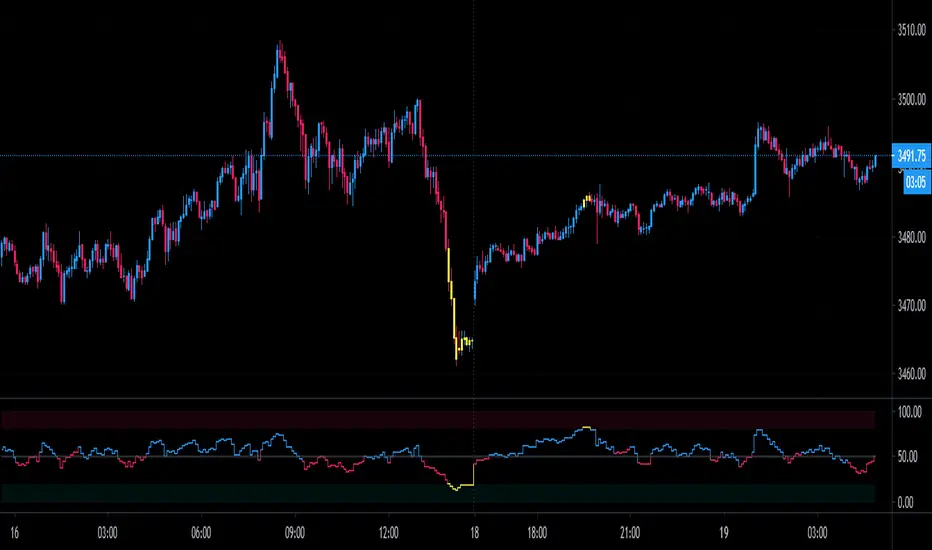
This is my version of an RSI. Basically treat it the same way, but needless to say there's a few more things going into it than just the closing price.
The color of the line is based on my HAMA JAMMA indicator so they could be used in conjunction to help pick potential trend reversals in either direction, overbought and oversold levels will turn the line yellow.
The "Make that a combo?" selection will change the curve and make it more sensitive to sharper price movements.
This works on any time frame as well as any bar type, although for certain bar types you'll probably have to tweak the settings to see what works.
I hope it helps,
Andre
Notas de prensa
To make it visually easier, at a user's request I added in barcolor for when the indicator is overbought or oversold so the bar itself will turn yellow.Script protegido
Este script se publica como código cerrado. No obstante, puede utilizarlo libremente y sin ninguna limitación. Obtenga más información aquí.
Exención de responsabilidad
La información y las publicaciones no constituyen, ni deben considerarse como asesoramiento o recomendaciones financieras, de inversión, de trading o de otro tipo proporcionadas o respaldadas por TradingView. Más información en Condiciones de uso.
Script protegido
Este script se publica como código cerrado. No obstante, puede utilizarlo libremente y sin ninguna limitación. Obtenga más información aquí.
Exención de responsabilidad
La información y las publicaciones no constituyen, ni deben considerarse como asesoramiento o recomendaciones financieras, de inversión, de trading o de otro tipo proporcionadas o respaldadas por TradingView. Más información en Condiciones de uso.