OPEN-SOURCE SCRIPT
Catastrophe Distance
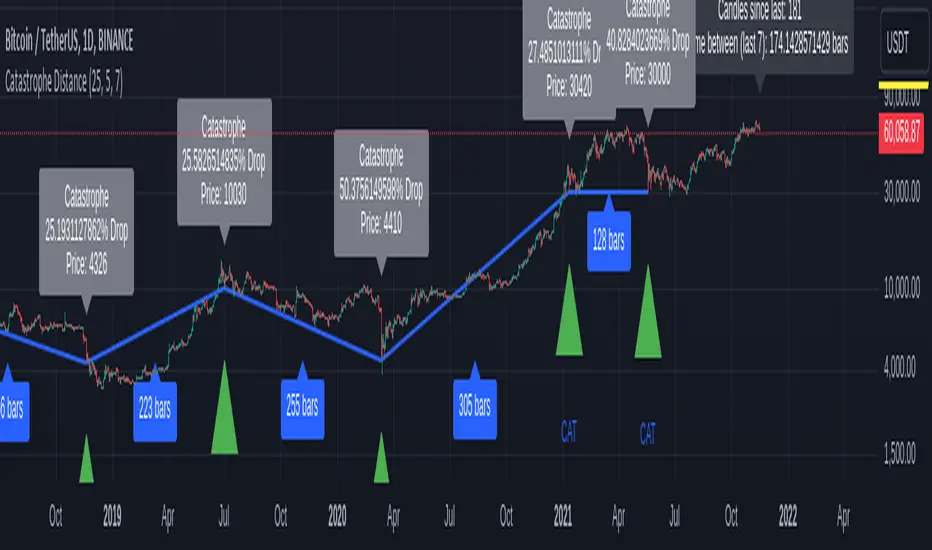
Catastrophe Distance is a tool to visually explore the time between catastrophic price moves.
Catastrophes are defined with 2 variables:
drawdown_threshold: the amount of percent the price has to fall
lookback_period = the amount of last candles in which drawdown_threshold was reached.
Drawdown_threshold per default is 25% and lookback_period is 5, meaning per default if price moves -25% in the last 5 candles you have a catastrophe.
Feel free to play around with this values to fit all the events you consider a catastrophe.
This indicator does not provide signals. It however implies caution if the time since the last catastrophe is higher then the average time between catastrophes (of last x catastrophes).
This is marked by the label over the current price showing the actual and average time since last catastrophe turning from green to black.
Given that the distance between catastrophes is somewhat cyclical:
Maybe now is a good time to start phishing for low limit orders and reduce leverage?
Script de código abierto
Fiel al espíritu de TradingView, el creador de este script lo ha convertido en código abierto, para que los traders puedan revisar y verificar su funcionalidad. ¡Enhorabuena al autor! Aunque puede utilizarlo de forma gratuita, recuerde que la republicación del código está sujeta a nuestras Normas internas.
Exención de responsabilidad
La información y las publicaciones no constituyen, ni deben considerarse como asesoramiento o recomendaciones financieras, de inversión, de trading o de otro tipo proporcionadas o respaldadas por TradingView. Más información en Condiciones de uso.