OPEN-SOURCE SCRIPT
Actualizado Visual RSI
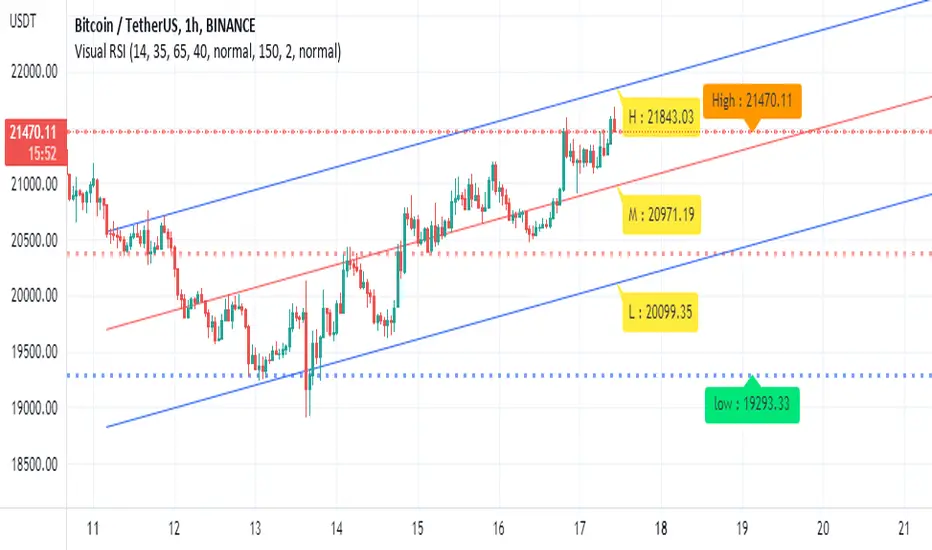
This is a visual format of regular RSI on the screen.
The indicator give you the RSI level for the high and lows and average as well. So it very easy to use it as you normally do with any RSI
buy point are when price reach bellow lower level and start breaking up. sell vice versa
it a concept idea to make our regular RSI more effective for the common user
I hope you like it
1 min chart

15min

The indicator give you the RSI level for the high and lows and average as well. So it very easy to use it as you normally do with any RSI
buy point are when price reach bellow lower level and start breaking up. sell vice versa
it a concept idea to make our regular RSI more effective for the common user
I hope you like it
1 min chart
15min
Notas de prensa
add linear regression to make analysis better Script de código abierto
Fiel al espíritu de TradingView, el creador de este script lo ha convertido en código abierto, para que los traders puedan revisar y verificar su funcionalidad. ¡Enhorabuena al autor! Aunque puede utilizarlo de forma gratuita, recuerde que la republicación del código está sujeta a nuestras Normas internas.
Exención de responsabilidad
La información y las publicaciones no constituyen, ni deben considerarse como asesoramiento o recomendaciones financieras, de inversión, de trading o de otro tipo proporcionadas o respaldadas por TradingView. Más información en Condiciones de uso.
Script de código abierto
Fiel al espíritu de TradingView, el creador de este script lo ha convertido en código abierto, para que los traders puedan revisar y verificar su funcionalidad. ¡Enhorabuena al autor! Aunque puede utilizarlo de forma gratuita, recuerde que la republicación del código está sujeta a nuestras Normas internas.
Exención de responsabilidad
La información y las publicaciones no constituyen, ni deben considerarse como asesoramiento o recomendaciones financieras, de inversión, de trading o de otro tipo proporcionadas o respaldadas por TradingView. Más información en Condiciones de uso.