OPEN-SOURCE SCRIPT
ABC Pattern
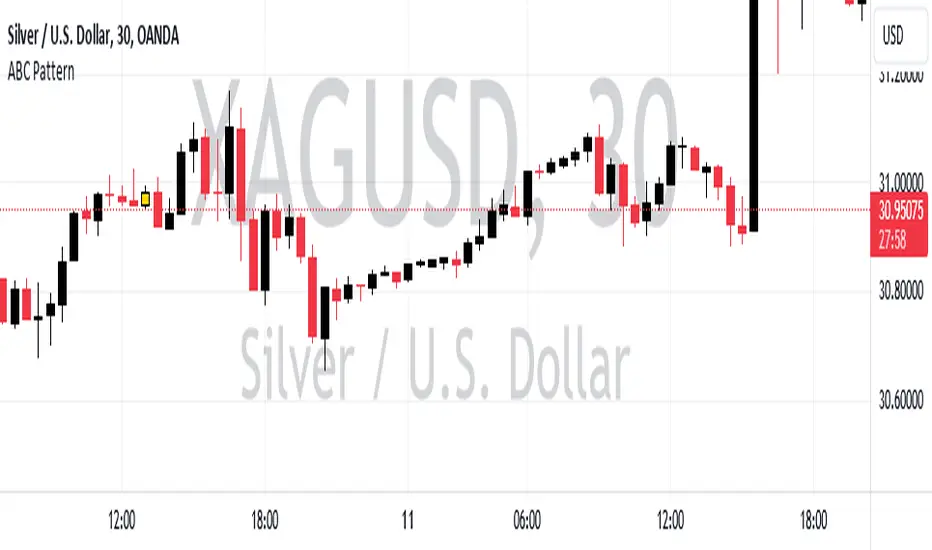
The indicator, named "ABC Pattern," is designed to identify specific bullish and bearish patterns on a price chart. Here's a simple explanation of what it does:
What the Indicator Does:
1. Identifies Bullish Patterns:
- The indicator looks for a sequence of candles where certain conditions are met to form a bullish pattern.
- When it detects a bullish pattern, it colors the candle that occurred three periods ago in gold.
2. Identifies Bearish Patterns:
- Similarly, it looks for a sequence of candles where certain conditions are met to form a bearish pattern.
- When it detects a bearish pattern, it colors the candle that occurred three periods ago in pinkish.
3. Creates Alerts:
- Whenever a bullish or bearish pattern is identified, the indicator generates an alert.
- The alert message includes the type of pattern (bullish or bearish), the price level at the time of detection, and the date and time of the pattern formation.
Detailed Conditions:
- Bullish Pattern:
- The current candle closes higher than it opened.
- The previous candle also closes higher than it opened.
- Two candles ago, the candle closed lower than it opened.
- Three candles ago, the candle closed higher than it opened.
- The highest price of two candles ago is below the current close.
- The lowest price of three candles ago is above the close of two candles ago.
- The highest price of three candles ago is below the current close.
- Bearish Pattern:
- The current candle closes lower than it opened.
- The previous candle also closes lower than it opened.
- Two candles ago, the candle closed higher than it opened.
- Three candles ago, the candle closed lower than it opened.
- The lowest price of two candles ago is above the current close.
- The highest price of three candles ago is below the close of two candles ago.
- The lowest price of three candles ago is above the current close.
Visual Representation:
- Gold Color: Indicates a detected bullish pattern.
- Pinkish Color: Indicates a detected bearish pattern.
Alerts:
- Alert Message: "ABC Pattern has appeared!"
- Detailed Alerts: Include the type of pattern, price level, and timestamp for better analysis and decision-making.
This indicator helps traders visually and audibly detect potential bullish and bearish patterns on their charts, aiding in making more informed trading decisions.
Script de código abierto
Fiel al espíritu de TradingView, el creador de este script lo ha convertido en código abierto, para que los traders puedan revisar y verificar su funcionalidad. ¡Enhorabuena al autor! Aunque puede utilizarlo de forma gratuita, recuerde que la republicación del código está sujeta a nuestras Normas internas.
Exención de responsabilidad
La información y las publicaciones no constituyen, ni deben considerarse como asesoramiento o recomendaciones financieras, de inversión, de trading o de otro tipo proporcionadas o respaldadas por TradingView. Más información en Condiciones de uso.