OPEN-SOURCE SCRIPT
Actualizado NYSE UVOL Ratio
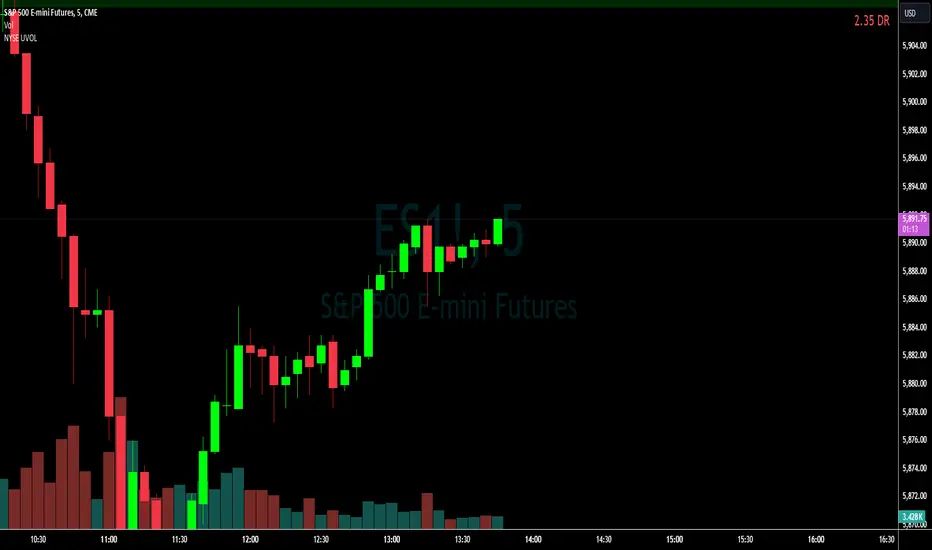
This Pine Script is designed to monitor and display the ratio of advancing volume (UVOL) to declining volume (DVOL) on the NYSE in real-time on your TradingView charts. Here's a breakdown of what each part of the script does:
Indicator Declaration: The script starts by declaring an indicator called "NYSE UVOL" with the option to overlay it directly on the price chart. This allows you to see the volume ratio in context with price movements.
Volume Data Fetching:
Advancing Volume (UVOL): It retrieves the closing value of the advancing volume from the NYSE.
Declining Volume (DVOL): It fetches the closing value of the declining volume.
Ratio Calculation:
The script calculates the ratio of advancing to declining volume. To avoid division by zero, it checks if the declining volume is not zero before performing the division.
Color Coding:
The script assigns a color to the ratio value based on set thresholds:
Red for a ratio less than 1 (more declining than advancing volume).
White for ratios between 1 and 2.
Lime for ratios between 2 and 3.
Green for ratios above 3.
Display Table:
A table is created in the top-right corner of the chart to display the current ratio value.
It updates this table with the latest ratio value at each new bar, displaying the ratio with appropriate color coding for quick reference.
This script provides a visual and numerical representation of market sentiment based on volume data, aiding traders in assessing the balance between buying and selling pressure.
Notas de prensa
Modified to avoid fractions when DVOL greater than UVOL.New values are displayed in red when DVOL exceeds UVOL and green when UVOL exceeds DVOL.
Script de código abierto
Fiel al espíritu de TradingView, el creador de este script lo ha convertido en código abierto, para que los traders puedan revisar y verificar su funcionalidad. ¡Enhorabuena al autor! Aunque puede utilizarlo de forma gratuita, recuerde que la republicación del código está sujeta a nuestras Normas internas.
Exención de responsabilidad
La información y las publicaciones no constituyen, ni deben considerarse como asesoramiento o recomendaciones financieras, de inversión, de trading o de otro tipo proporcionadas o respaldadas por TradingView. Más información en Condiciones de uso.