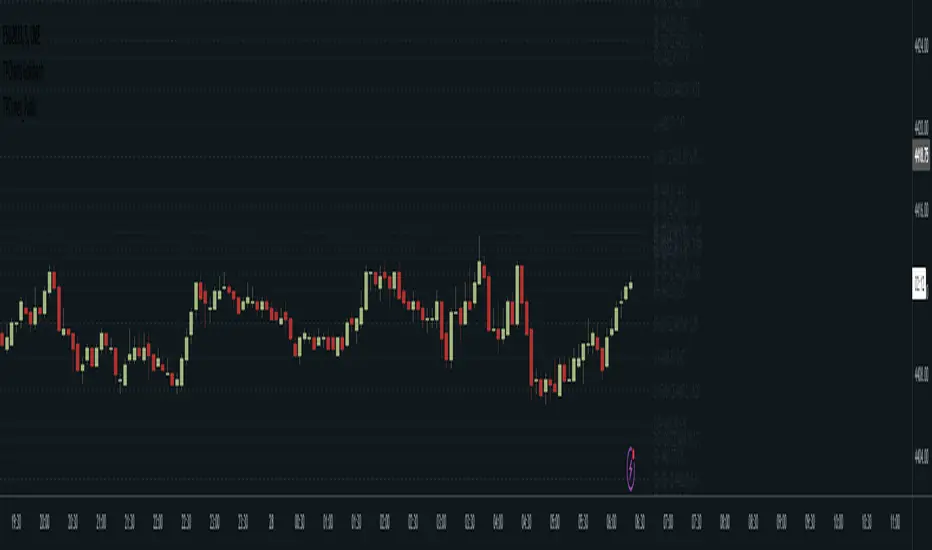
TPCLines_Public

Helpers for lines
lineVA(start, lines, labels, lineColor, labelBgColor, labelTextColor, highPrice, lowPrice, extend, style, width, labelText, labelSize, labelStyle, labelTextAlign, bi) Draws a vertical line and optional label on the chart.
Parameters:
start: The start bar index or time.
lines: Line array to which the created line will be pushed.
labels: Label array to which the created label will be pushed.
lineColor: The color for the line and label.
labelBgColor: The background color for the label.
labelTextColor: The text color for the label.
highPrice: The upper price for the line.
lowPrice: The lower price for the line.
extend: Options for toggline line extend (extend.right, extend.left, extend.both, or extend.none). If none is provided, provides a best guess.
style: The line's style. Defaults to line.style_dotted.
width: The line's width. Defaults to 1.
labelText: Optional text to display next to the line.
labelSize: The label's size. Defaults to size.tiny.
labelStyle: The label's style. Defaults to label.style_label_left.
labelTextAlign: The label's text alignment. Defaults to text.align_center.
bi: Set true to use bar indices, set false to use time. Defaults to true (use bar indices).
Returns: Nothing. Draws a line and optional label on the chart.
lineHA(price, lines, labels, lineColor, labelBgColor, extend, labelTextColor, labelText, end, start, bi, showPrice, pips, style, width, labelAlign, labelSize, labelStyle, labelTextAlign) Draws a horizontal line and optional label on the chart.
Parameters:
price: The price at which to draw the lie.
lines: Line array to which the created line will be pushed.
labels: Label array to which the created label will be pushed.
lineColor: The color for the line and label.
labelBgColor: The background color for the label.
extend: Options for toggline line extend (extend.right, extend.left, extend.both, or extend.none). Defaults to extend.none.
labelTextColor: The text color for the label.
labelText: Optional text to display next to the line.
end: The time or bar index to end the line at.
start: The time or bar index to start the line at.
bi: Set true to use bar indices, set false to use time. Defaults to true (use bar indices).
showPrice: Option to show the price on the label.
pips: If a value is provided, will be displayed on the label.
style: The line's style. Defaults to line.style_solid.
width: The line's width. Defaults to 1.
labelAlign: Which side of the line to align the label on. Can be r for right, l for left, c for center, or t for the current time.
labelSize: The label's size. Defaults to size.tiny.
labelStyle: The label's style. Defaults to label.style_none.
labelTextAlign: The label's text alignment. Defaults to text.align_center.
Returns: Nothing. Draws a line and optional label on the chart.
lineH()
lineV()
Biblioteca Pine
Fiel al espíritu de TradingView, el autor ha publicado este código de Pine como biblioteca de código abierto, para que otros programadores Pine de nuestra comunidad puedan reutilizarlo. ¡Enhorabuena al autor! Puede usar esta biblioteca de forma privada o en otras publicaciones de código abierto, pero la reutilización de este código en publicaciones está sujeta a nuestras Normas internas.
Exención de responsabilidad
Biblioteca Pine
Fiel al espíritu de TradingView, el autor ha publicado este código de Pine como biblioteca de código abierto, para que otros programadores Pine de nuestra comunidad puedan reutilizarlo. ¡Enhorabuena al autor! Puede usar esta biblioteca de forma privada o en otras publicaciones de código abierto, pero la reutilización de este código en publicaciones está sujeta a nuestras Normas internas.