OPEN-SOURCE SCRIPT
Boness 1964 Option Pricing Formula [Loxx]
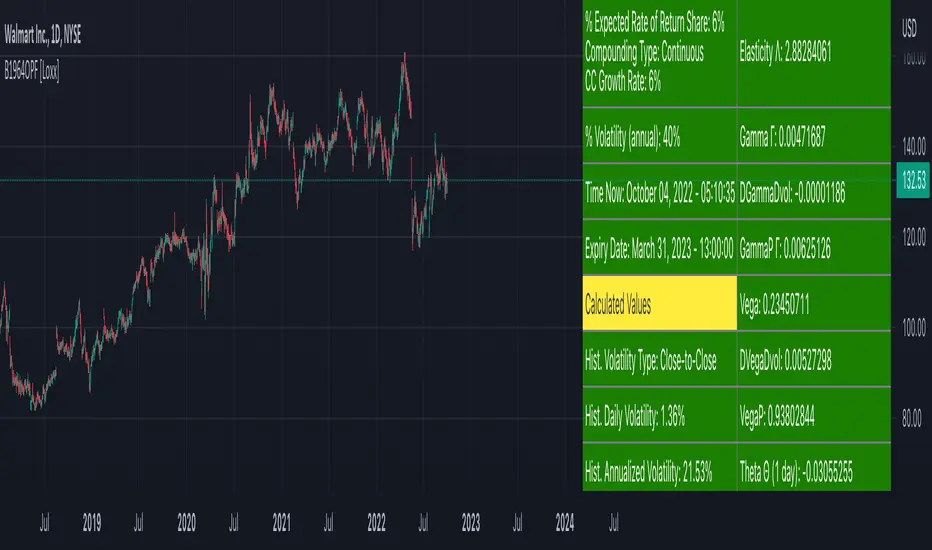
Boness 1964 Option Pricing Formula [Loxx] is an options pricing model that pre-dates Black-Scholes-Merton. This model includes Analytical Greeks.
Boness (1964) assumed a lognormal asset price. Boness derives the following value for a call option:
c = SN(d1) - Xe^(rho * T)N(d2)
d1 = (log(S / X) + (rho + v^2 / 2) * T) / (v * T^0.5)
d2 = d1 - (v * T^0.5)
where rho is the expected rate of return to the asset.
Analytical Greeks
Inputs
S = Stock price.
X = Strike price of option.
T = Time to expiration in years.
r = Expected Rate of Return
v = Volatility of the underlying asset price
cnd (x) = The cumulative normal distribution function
nd(x) = The standard normal density function
convertingToCCRate(r, cmp ) = Rate compounder
Things to know
Boness (1964) assumed a lognormal asset price. Boness derives the following value for a call option:
c = SN(d1) - Xe^(rho * T)N(d2)
d1 = (log(S / X) + (rho + v^2 / 2) * T) / (v * T^0.5)
d2 = d1 - (v * T^0.5)
where rho is the expected rate of return to the asset.
Analytical Greeks
- Delta Greeks: Delta, DDeltaDvol, Elasticity
- Gamma Greeks: Gamma, GammaP, DGammaDvol, Speed
- Vega Greeks: Vega , DVegaDvol/Vomma, VegaP
- Theta Greeks: Theta
- Probability Greeks: StrikeDelta, Risk Neutral Density, Rho Expected Rate of Return
Inputs
S = Stock price.
X = Strike price of option.
T = Time to expiration in years.
r = Expected Rate of Return
v = Volatility of the underlying asset price
cnd (x) = The cumulative normal distribution function
nd(x) = The standard normal density function
convertingToCCRate(r, cmp ) = Rate compounder
Things to know
- Only works on the daily timeframe and for the current source price.
- You can adjust the text size to fit the screen
Script de código abierto
Fiel al espíritu de TradingView, el creador de este script lo ha convertido en código abierto, para que los traders puedan revisar y verificar su funcionalidad. ¡Enhorabuena al autor! Aunque puede utilizarlo de forma gratuita, recuerde que la republicación del código está sujeta a nuestras Normas internas.
Public Telegram Group, t.me/algxtrading_public
VIP Membership Info: patreon.com/algxtrading/membership
VIP Membership Info: patreon.com/algxtrading/membership
Exención de responsabilidad
La información y las publicaciones no constituyen, ni deben considerarse como asesoramiento o recomendaciones financieras, de inversión, de trading o de otro tipo proporcionadas o respaldadas por TradingView. Más información en Condiciones de uso.