PROTECTED SOURCE SCRIPT
Actualizado Uptrick: 6 Coins Market Data Table
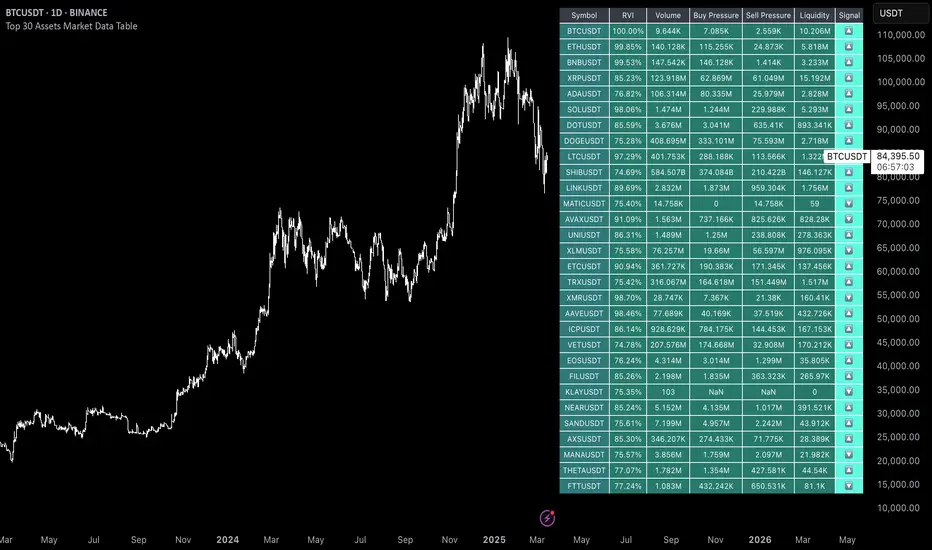
The "Uptrick: 6 Coins Market Data Table" indicator is a sophisticated tool designed to provide a comprehensive snapshot of the market data for six major cryptocurrencies. This tool displays crucial information in a table format directly on the chart, enabling traders to make informed decisions quickly. It focuses on providing key metrics such as the Relative Volatility Index (RVI), volume, buy and sell pressure, and liquidity for each coin. The primary purpose of this indicator is to consolidate essential market data for multiple cryptocurrencies into a single, easy-to-read table. This facilitates quick analysis and comparison, helping traders assess market volatility and momentum using the Relative Volatility Index (RVI), monitor trading volume to understand market activity and interest, evaluate buy and sell pressure to gauge market sentiment, and determine liquidity to understand the ease of entering or exiting positions. The indicator is titled "Uptrick: 6 Coins Market Data Table" and is set to overlay on the chart, ensuring that it does not obstruct the view of price action. It uses a custom function to calculate buy and sell pressure based on price movements and trading volume, where buy pressure measures the volume of trades executed at prices above the low but below the high, indicating buying interest, and sell pressure measures the volume of trades executed at prices below the high but above the low, indicating selling interest. Liquidity is calculated as the product of the trading range (high - low) and the trading volume, helping in understanding the ease with which an asset can be traded without affecting its price. The RVI is calculated using the standard deviation of price changes and the exponential moving average (EMA), distinguishing between periods of increasing and decreasing volatility to provide a normalized measure of market volatility, with the RVI value ranging from 0 to 100, where higher values indicate higher volatility. The table is created with six rows and seven columns, with each row representing a cryptocurrency and each column representing a specific metric. The first row of the table includes headers for each metric: Symbol, RVI, Volume, Buy Pressure, Sell Pressure, and Liquidity. The populateTable function retrieves and calculates the necessary data for each cryptocurrency, fetching open, high, low, close prices, and volume, then calculating the RVI, buy/sell pressure, and liquidity. These values are populated into the respective cells in the table, ensuring that traders can see all relevant data at a glance. The indicator allows users to specify six different cryptocurrency symbols through input fields, enabling traders to monitor their preferred coins. The table columns include Symbol (the trading symbol of the cryptocurrency, e.g., BTCUSDT), RVI (the Relative Volatility Index displayed as a percentage, indicating the volatility level), Volume (the trading volume for the specified period, indicating the level of trading activity), Buy Pressure (a volume-based measure of buying interest), Sell Pressure (a volume-based measure of selling interest), and Liquidity (a measure of the asset’s liquidity, combining price range and volume). By bringing together multiple key metrics for six cryptocurrencies into one table, the indicator provides a centralized view of market conditions, enhancing decision-making as traders can quickly assess volatility, market sentiment, and liquidity, aiding in more informed trading decisions. The tool's customizability, allowing users to tailor the table to display their preferred cryptocurrencies, makes it versatile for different trading strategies. This detailed description outlines the functionality and purpose of the "Uptrick: 6 Coins Market Data Table" indicator, emphasizing its role in providing comprehensive and actionable market data for traders.
Notas de prensa
This update moves the script from version 5 to version 6. The table now displays market data for 30 assets instead of 6 coins. Instead of separate inputs for each asset, an array is used to store all asset symbols, and header names and colors are managed via arrays. The updated script includes individual alert conditions for each asset based on the Relative Volatility Index (RVI) and calculated buy/sell pressure values. In addition, the code has been restructured for improved readability and scalability, with more detailed table population logic and refined color settings for different columns.Script protegido
Este script se publica como código cerrado. No obstante, puede utilizarlo libremente y sin ninguna limitación. Obtenga más información aquí.
💎 Free Discord: discord.gg/Def47ueyuD
💎 Website: uptrick.io
Nothing is financial advice. Always do your own research.
💎 Website: uptrick.io
Nothing is financial advice. Always do your own research.
Exención de responsabilidad
La información y las publicaciones no constituyen, ni deben considerarse como asesoramiento o recomendaciones financieras, de inversión, de trading o de otro tipo proporcionadas o respaldadas por TradingView. Más información en Condiciones de uso.
Script protegido
Este script se publica como código cerrado. No obstante, puede utilizarlo libremente y sin ninguna limitación. Obtenga más información aquí.
💎 Free Discord: discord.gg/Def47ueyuD
💎 Website: uptrick.io
Nothing is financial advice. Always do your own research.
💎 Website: uptrick.io
Nothing is financial advice. Always do your own research.
Exención de responsabilidad
La información y las publicaciones no constituyen, ni deben considerarse como asesoramiento o recomendaciones financieras, de inversión, de trading o de otro tipo proporcionadas o respaldadas por TradingView. Más información en Condiciones de uso.