OPEN-SOURCE SCRIPT
Actualizado Interval Volatility Bands [DW]

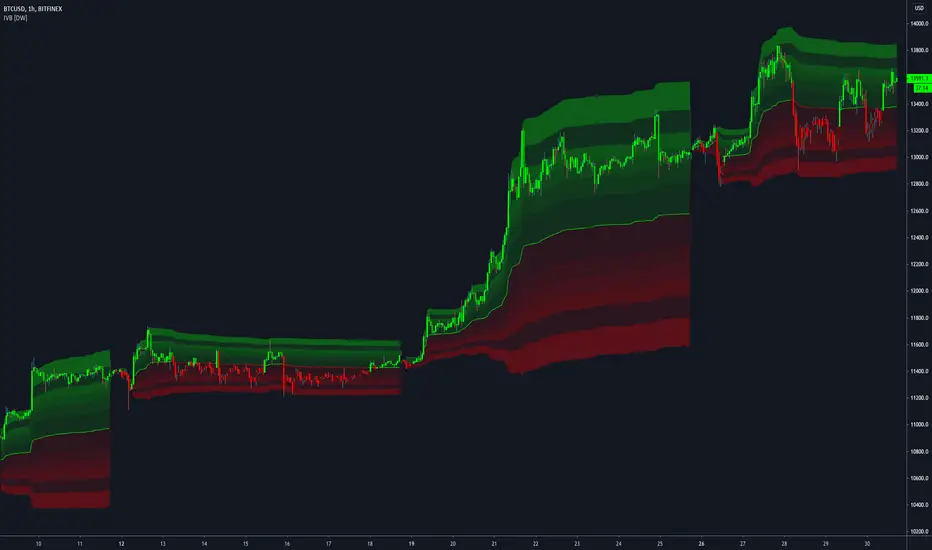
This is an experimental study that utilizes Volume Weighted Average Price or Time Weighted Average Price calculations, Bollinger Bands, and Fibonacci numbers to estimate volatility over a specified interval.
First, the basis is calculated by selecting:
-VWAP, which has the option to be calculated using real volume or tick volume
-TWAP, which has the option to be calculated using the standard method or exponential method
Next, standard deviation from the basis is calculated and multiplied by a specified expansion coefficient. The result is then added to and subtracted from the basis to calculate the high and low bands.
There are three band calculation methods to chosse from in this script:
-Standard, which uses the default calculations
-Average, which takes a cumulative average of standard deviation
-Hybrid, which takes the maximum of the standard and average standard deviation methods
Lastly, the high and low band ranges are multiplied by Fibonacci Percentages 23.6 - 78.6.
A custom color scheme with eight default presets to choose from is included.
Notas de prensa
//Updates://I altered the inputs for a simpler experience. Calculation method, VWAP volume type, TWAP smoothing type, band calculation method, and color scheme are all controlled with easy to use dropdown menus.
//An option to use automatic interval settings is now available. You can still choose a custom interval by deselecting this option.
//Double Exponential Time Weighted Average Price (DETWAP) has been added to the script. Simply select "Double Exponential" from the TWAP Smoothing Type menu to enable it.
//I also added a couple new color schemes to the mix, Prism 1 and Prism 2, which are multicolored themes for those who like a bit of variety in their colors.
Notas de prensa
Updates:In the midst of migrating the script from pine v2 to v3, I forgot that the lookahead settings need to be changed on security functions.
v3 by default turns lookahead off, resulting in the security function tracking current resolution data on the current bar, and alternate resolution data in the past.
Lookahead has been turned back on so the alternate resolution results reflect on the current bar.
Notas de prensa
Updates:Fixed a repainting issue in the script by changing the interval renewal condition.
Notas de prensa
Updates:-> Migrated to v4.
-> Reorganized script structure.
-> Reduced clutter for quicker compile.
Notas de prensa
Updates:- Rebuilt the weighted average price functions using Pine's new array data structures.
- Condensed interval calculation options into a singular dropdown tab with 4 options to choose from:
-> Automatic Segmented - Automatically chooses a timeframe for a segmented interval.
-> Custom Segmented - Uses a user defined interval based on an input resolution.
-> Cumulative - Uses the entire chart to cumulatively calculate.
-> Time Anchored Cumulative - Cumulatively calculates from a user defined point in time. If the time is before the time of the first bar, this behaves the same as the cumulative option.
- Reorganized the GUI.
Script de código abierto
Fiel al espíritu de TradingView, el creador de este script lo ha convertido en código abierto, para que los traders puedan revisar y verificar su funcionalidad. ¡Enhorabuena al autor! Aunque puede utilizarlo de forma gratuita, recuerde que la republicación del código está sujeta a nuestras Normas internas.
For my full list of premium tools, check the blog:
wallanalytics.com/
Reach out on Telegram:
t.me/DonovanWall
wallanalytics.com/
Reach out on Telegram:
t.me/DonovanWall
Exención de responsabilidad
La información y las publicaciones no constituyen, ni deben considerarse como asesoramiento o recomendaciones financieras, de inversión, de trading o de otro tipo proporcionadas o respaldadas por TradingView. Más información en Condiciones de uso.