OPEN-SOURCE SCRIPT
Actualizado Volume Candlestick Heatmap Colors [vnhilton]
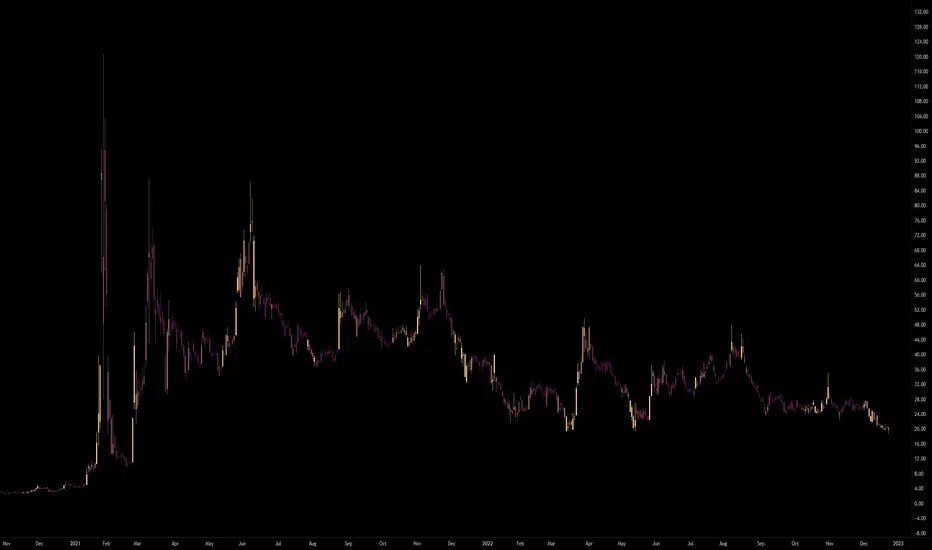
This indicator colours candles based on their volume for a set period of time. The highest volume & lowest volume in this period are set by 2 colours, & any candle with volume inside the range will have a colour based on the gradient created by the 2 colours. Ability to hide the candle body, wick, border if preferred (Hide candlestick body, wick, border, through the settings if applicable). Features 20 pre-set themes + ability to set your own custom theme.

Anamnisar; Aubergine; Between The Clouds; Bichrome

Bora Bora; Candy; Cherryblossoms; Dracula

Dance To Forget; Fresh Turboscent; Friday; Frozen

Miaka; Minnesota Vikings; Misty Meadow; Monochrome

Neon Life; Purple Bliss; Purple Paradise; Sea Blizz

Shore; Sky; Starfall; Superman

Talking To Mice Elf; The Strain; Winter; Vasily
Anamnisar; Aubergine; Between The Clouds; Bichrome
Bora Bora; Candy; Cherryblossoms; Dracula
Dance To Forget; Fresh Turboscent; Friday; Frozen
Miaka; Minnesota Vikings; Misty Meadow; Monochrome
Neon Life; Purple Bliss; Purple Paradise; Sea Blizz
Shore; Sky; Starfall; Superman
Talking To Mice Elf; The Strain; Winter; Vasily
Notas de prensa
CORRECTION: 28* themes not 20.Notas de prensa
- Added new price types: Bar, line (which also includes step line, step line w/ diamonds, histogram, cross, area, area with breaks, columns, circles)From left to right: bar; candlestick; line
Notas de prensa
- Added separate theme colors for ETH pricesETH prices in monochrome theme; RTH prices in custom "dracula" theme.
Notas de prensa
- Added volume circles that appear when the volume is the maximum out of the selected period by the user. These circles are adjustable in size and have separate colors for ETH and RTH.Maximum volume circles for RTH and ETH. Notice how volume comes in around technical analysis setups.
Script de código abierto
Fiel al espíritu de TradingView, el creador de este script lo ha convertido en código abierto, para que los traders puedan revisar y verificar su funcionalidad. ¡Enhorabuena al autor! Aunque puede utilizarlo de forma gratuita, recuerde que la republicación del código está sujeta a nuestras Normas internas.
Exención de responsabilidad
La información y las publicaciones no constituyen, ni deben considerarse como asesoramiento o recomendaciones financieras, de inversión, de trading o de otro tipo proporcionadas o respaldadas por TradingView. Más información en Condiciones de uso.