OPEN-SOURCE SCRIPT
Actualizado Volatility Meter

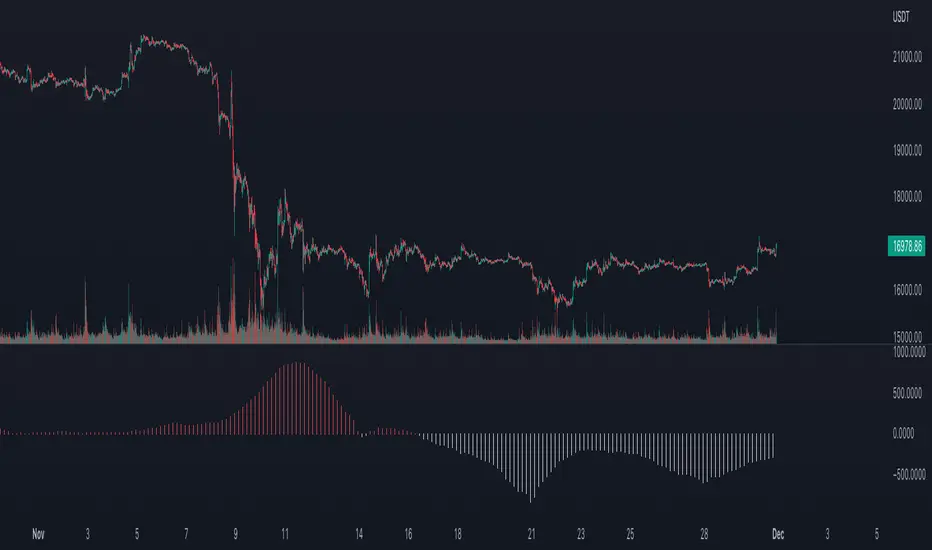
The title is quite self explanatory. It is a Volatility Meter based on Bollinger Bands Width and MA.
These parameters can be selected by users in settings tab:
- Basic Bollinger Bands Parameters: length, standart deviation and source
- Timeframes: 1h, 2h, 3h and 4h
If the indicator is red it means volatility is high in the market. If it is white, it means that market is not volatile right now.
These parameters can be selected by users in settings tab:
- Basic Bollinger Bands Parameters: length, standart deviation and source
- Timeframes: 1h, 2h, 3h and 4h
If the indicator is red it means volatility is high in the market. If it is white, it means that market is not volatile right now.
Notas de prensa
The title is self-explanatory. It is a Volatility Meter based on Bollinger Bands Width and Moving Averages. It also uses the concept of multi-time frame analysis.You can decide the options below on the settings tab:
- Basic Bollinger Bands Parameters: length, standart deviation and source
- Timeframes: 1h, 2h, 3h and 4h
If the indicator is red, it means volatility is high in the market. If it is white, it means the market is not volatile right now. If you use it in a smaller timeframe than it is calculated then you will get the multi-timeframe analysis of the volatility. As could be seen on the chart above, if it is red it usually means that big market moves are expected.
Use it on 4H or smaller time frames to get the multi-time frame volatility insight. If you use it on the time frame greater than 4H please select the calculated time frame accordingly. (NOTE: credits on the source code is removed.)
Script de código abierto
Fiel al espíritu de TradingView, el creador de este script lo ha convertido en código abierto, para que los traders puedan revisar y verificar su funcionalidad. ¡Enhorabuena al autor! Aunque puede utilizarlo de forma gratuita, recuerde que la republicación del código está sujeta a nuestras Normas internas.
Exención de responsabilidad
La información y las publicaciones no constituyen, ni deben considerarse como asesoramiento o recomendaciones financieras, de inversión, de trading o de otro tipo proporcionadas o respaldadas por TradingView. Más información en Condiciones de uso.