PROTECTED SOURCE SCRIPT
Actualizado Multi-Asset Correlation Coeff

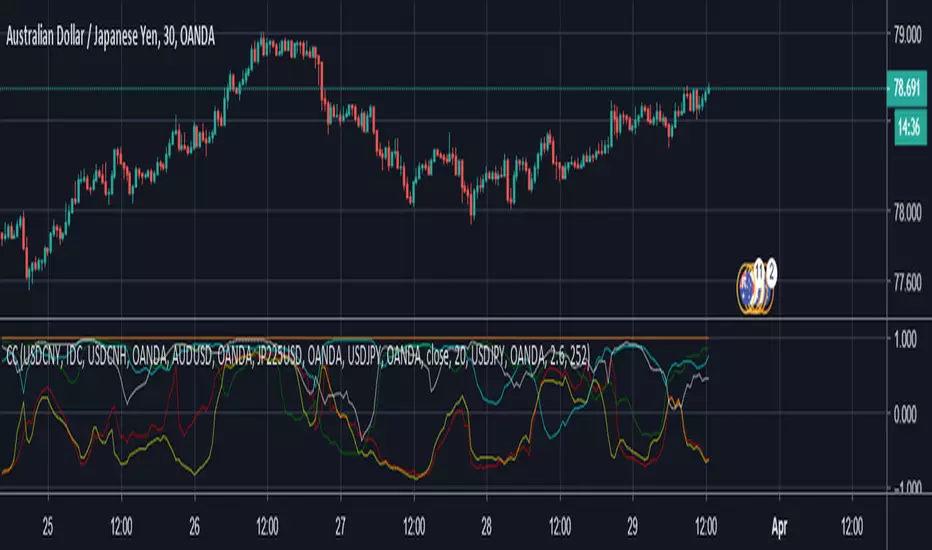
This is just a modified correlation coefficient indicator that shows the correlation coefficient between five different assets and the one on the chart.
Notas de prensa
This new version now also include Beta Factor (the orange line). Now instead of just looking at correlations, you can also track the beta between an asset and a benchmark. Beta looks at how much an asset moves compared to a benchmark. For example Apple is one of the companies in the S&P500, and lets say that stock had a Beta Factor of 2. That would mean that for every 1 point move in the S&P, apple would move 2. This can be used for:- Stocks and their respective indices
- Commodities and their respective indices
- Currencies (this is a little more difficult to do because there's no real index for currencies, but it can be done)
- ETC.
If the indicator is becoming too cluttered with all the correlations and Beta Factor, then just hide some of the lines.
Notas de prensa
This update includes a corrected formulation of the Beta Factor, and allows you to use a moving average of the Beta Factor. If you just want the current Beta Factor set the Beta length to 1.Notas de prensa
No the Risk Free Rate for some of the major markets are listed so you don't have to look them up. (If the markets not listed just go to marketwatch.com and look up the 10 year treasury bond for the rate for that specific country.)Script protegido
Este script se publica como código cerrado. No obstante, puede utilizarlo libremente y sin ninguna limitación. Obtenga más información aquí.
Exención de responsabilidad
La información y las publicaciones no constituyen, ni deben considerarse como asesoramiento o recomendaciones financieras, de inversión, de trading o de otro tipo proporcionadas o respaldadas por TradingView. Más información en Condiciones de uso.
Script protegido
Este script se publica como código cerrado. No obstante, puede utilizarlo libremente y sin ninguna limitación. Obtenga más información aquí.
Exención de responsabilidad
La información y las publicaciones no constituyen, ni deben considerarse como asesoramiento o recomendaciones financieras, de inversión, de trading o de otro tipo proporcionadas o respaldadas por TradingView. Más información en Condiciones de uso.