OPEN-SOURCE SCRIPT
Actualizado Average Candle Range [UkutaLabs]
█ OVERVIEW
The Average Candle Range is a powerful indicator that compares the size of the current bar to past bars. This comparison can be used in a wide variety of trading strategies, allowing traders to understand at a glance the relative size of each candle.
█ USAGE
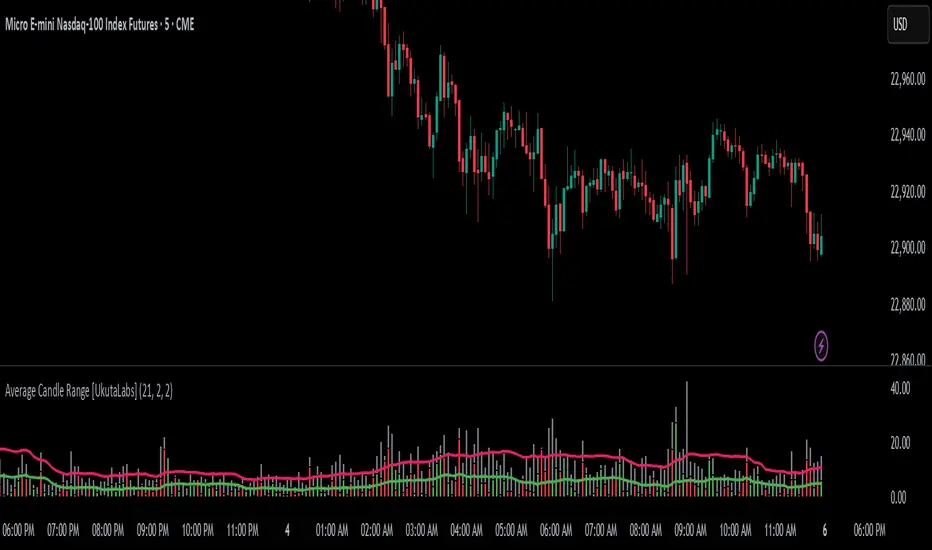
As each candlestick forms, two bars will be plotted on the indicator. The grey bar represents the total range of the candle from the high to the low, and the second bar represents the body of the bar from the open to the close. Depending on whether the bar is bullish or bearish, the second bar will be colored green or red respectively.
Two averages will also be drawn over these bars that represent the average size of the two bar types over a period that is specified by the user. These averages can be toggled in the indicator settings.
█ SETTINGS
Configuration
• Period: Determines how many bars to use in the calculation of the averages.
• Show Bar Average: Determines whether or not the average for the full bar size is displayed.
• Show Body Average: Determines whether or not the average for the body is displayed.
The Average Candle Range is a powerful indicator that compares the size of the current bar to past bars. This comparison can be used in a wide variety of trading strategies, allowing traders to understand at a glance the relative size of each candle.
█ USAGE
As each candlestick forms, two bars will be plotted on the indicator. The grey bar represents the total range of the candle from the high to the low, and the second bar represents the body of the bar from the open to the close. Depending on whether the bar is bullish or bearish, the second bar will be colored green or red respectively.
Two averages will also be drawn over these bars that represent the average size of the two bar types over a period that is specified by the user. These averages can be toggled in the indicator settings.
█ SETTINGS
Configuration
• Period: Determines how many bars to use in the calculation of the averages.
• Show Bar Average: Determines whether or not the average for the full bar size is displayed.
• Show Body Average: Determines whether or not the average for the body is displayed.
Notas de prensa
Added ability to customize the 'Averages' lines - color and size.Script de código abierto
In true TradingView spirit, the creator of this script has made it open-source, so that traders can review and verify its functionality. Kudos to the author! While you can use it for free, remember that republishing the code is subject to our House Rules.
Exención de responsabilidad
The information and publications are not meant to be, and do not constitute, financial, investment, trading, or other types of advice or recommendations supplied or endorsed by TradingView. Read more in the Terms of Use.
Script de código abierto
In true TradingView spirit, the creator of this script has made it open-source, so that traders can review and verify its functionality. Kudos to the author! While you can use it for free, remember that republishing the code is subject to our House Rules.
Exención de responsabilidad
The information and publications are not meant to be, and do not constitute, financial, investment, trading, or other types of advice or recommendations supplied or endorsed by TradingView. Read more in the Terms of Use.