OPEN-SOURCE SCRIPT
Actualizado RM Timeframe Continuity

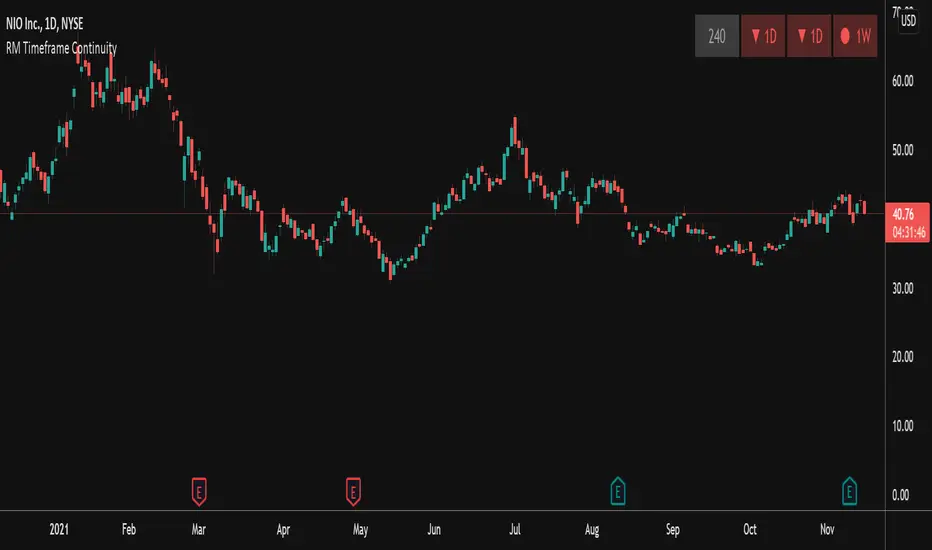
This indicator plots a table off to the right of the chart to help with determining timeframe continuity. Per the Strat, a great edge is only taking trades where full timeframe continuity is in place (i.e. if you are going long, make sure other timeframes are also green).
In this script:
User defined options:
In this script:
- Green candles have green colored boxes, red candles have red colored boxes.
- Inside bars are represented by a circle - ⬤
- Outside bars are represented by a tall rectangle - ▮
- 2-up bars are indicated by an up arrow - ▲
- 2-down bars are indicated by a down arrow - ▼
User defined options:
- Pick any timeframe for the 4 boxes
- Choose whether to plot the highs/lows of the larger timeframe candles as horizontal rays on your chart (along with the associated colors)
Notas de prensa
Fixing a bug with the glyphs of the 4th box.Script de código abierto
Fiel al espíritu de TradingView, el creador de este script lo ha convertido en código abierto, para que los traders puedan revisar y verificar su funcionalidad. ¡Enhorabuena al autor! Aunque puede utilizarlo de forma gratuita, recuerde que la republicación del código está sujeta a nuestras Normas internas.
Exención de responsabilidad
La información y las publicaciones no constituyen, ni deben considerarse como asesoramiento o recomendaciones financieras, de inversión, de trading o de otro tipo proporcionadas o respaldadas por TradingView. Más información en Condiciones de uso.
Script de código abierto
Fiel al espíritu de TradingView, el creador de este script lo ha convertido en código abierto, para que los traders puedan revisar y verificar su funcionalidad. ¡Enhorabuena al autor! Aunque puede utilizarlo de forma gratuita, recuerde que la republicación del código está sujeta a nuestras Normas internas.
Exención de responsabilidad
La información y las publicaciones no constituyen, ni deben considerarse como asesoramiento o recomendaciones financieras, de inversión, de trading o de otro tipo proporcionadas o respaldadas por TradingView. Más información en Condiciones de uso.