OPEN-SOURCE SCRIPT
Actualizado Price Change History

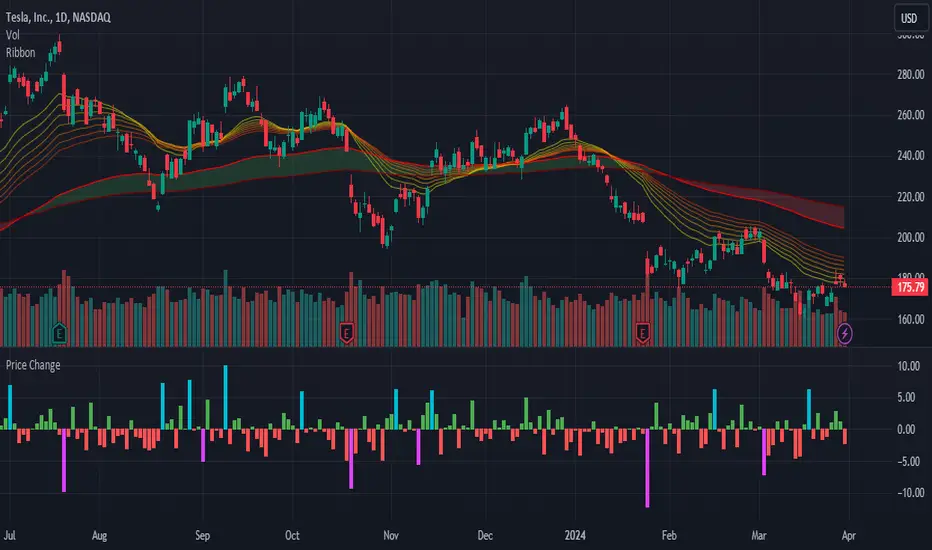
Display a histogram of price changes over a given interval. Show change as a percentage or in dollar amount. Highlight changes that exceed a particular value.
Notas de prensa
By default, the histogram shows price change since the previous bar. This update allows you to display price change since any number of bars ago.Notas de prensa
Separate high and low highlighting.Notas de prensa
Update study shorttitle.Notas de prensa
The ratio of highlighted to unhighlighted bars is now shown as the orange number ranging from 0 to 1.It takes into consideration the previous 50 bars by default, but can be changed by the user under settings.
Notas de prensa
- Updated the names of a few settings to be clearer as to what they do.- Included some documentation in the source code to explain each setting.
Notas de prensa
- Add default precision
- Improve comments
Notas de prensa
Updated to Pine Script v4Notas de prensa
- Update to Pine Script v5- Additional comments
- Code cleanup
Script de código abierto
Fiel al espíritu de TradingView, el creador de este script lo ha convertido en código abierto, para que los traders puedan revisar y verificar su funcionalidad. ¡Enhorabuena al autor! Aunque puede utilizarlo de forma gratuita, recuerde que la republicación del código está sujeta a nuestras Normas internas.
Exención de responsabilidad
La información y las publicaciones no constituyen, ni deben considerarse como asesoramiento o recomendaciones financieras, de inversión, de trading o de otro tipo proporcionadas o respaldadas por TradingView. Más información en Condiciones de uso.