OPEN-SOURCE SCRIPT
Options Series - MTF_Parabolic_SAR
⭐ Purpose of the Script
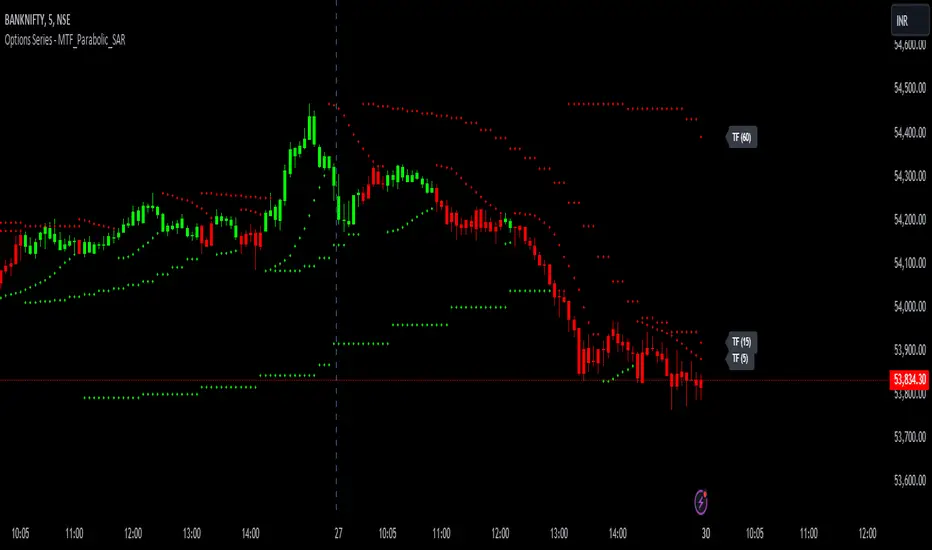
This script, titled "Options Series - MTF_Parabolic_SAR," is designed for analyzing price trends using the Parabolic SAR (Stop and Reverse) indicator across multiple timeframes (MTF). It dynamically highlights bullish and bearish conditions, helping traders identify trends with improved accuracy. The script uses the Parabolic SAR across three customizable timeframes (default: 5, 15, and 60 minutes) to gauge the market sentiment.
⭐ Key Features and Insights:
- Multi-Timeframe Parabolic SAR: The script calculates the Parabolic SAR for three different timeframes (input_tf_1, input_tf_2, and input_tf_3). Traders can configure these timeframes to match their trading style (e.g., intraday, swing).
The SAR plots adapt to the selected timeframe, helping traders see different perspectives of price movement, such as short-term and long-term trends. - Bullish and Bearish Conditions: The script determines bullish and bearish conditions by comparing the close price against the Parabolic SAR in each timeframe.
If at least one timeframe indicates a bullish condition (close price above SAR), the bars are colored green. Conversely, if one timeframe signals bearish conditions (close below SAR), the bars turn red.
This provides an at-a-glance view of the price trend across multiple timeframes, offering insights into the market's strength and direction. - Visual Enhancements:Bar Coloring: Bars are visually enhanced with a color scheme: green for bullish, red for bearish, and gray for neutral conditions. This makes it easy to spot market trends and reversals directly on the chart. Candle Plotting: The current candle is plotted with the corresponding color and labeled with the SAR values for each timeframe. This aids traders in tracking real-time price action.
- Labeling of SAR Values: The script displays SAR values for each timeframe as floating labels next to the chart. These labels contain the timeframe and the exact SAR value, making it easier to reference without cluttering the chart.
⭐ Trading Advantages:
- Customizable and Adaptive: The customizable timeframes and SAR settings allow traders to adapt the script to various market conditions and their specific trading strategies. This flexibility provides a powerful tool for identifying entry and exit points.
- Multi-Timeframe Insights: By considering multiple timeframes, the script offers a comprehensive market view, making it easier to confirm strong trends and avoid false signals.
⭐ How It Helps Traders:
- Trend Identification: By visualizing Parabolic SAR across multiple timeframes, traders can quickly assess trend strength and direction.
- Reversal Detection: The script's color changes (green to red or vice versa) signal potential trend reversals, offering critical information for managing trades and reducing risk.
🚀 Conclusion:
This script provides traders with a multi-timeframe analysis tool for identifying trends and potential reversals using the Parabolic SAR. By offering customizable timeframes, clear visual cues, and SAR value labeling, it simplifies decision-making and enhances market insights.
Script de código abierto
Fiel al espíritu de TradingView, el creador de este script lo ha convertido en código abierto, para que los traders puedan revisar y verificar su funcionalidad. ¡Enhorabuena al autor! Aunque puede utilizarlo de forma gratuita, recuerde que la republicación del código está sujeta a nuestras Normas internas.
Exención de responsabilidad
La información y las publicaciones no constituyen, ni deben considerarse como asesoramiento o recomendaciones financieras, de inversión, de trading o de otro tipo proporcionadas o respaldadas por TradingView. Más información en Condiciones de uso.