OPEN-SOURCE SCRIPT
Dominance Dashboard
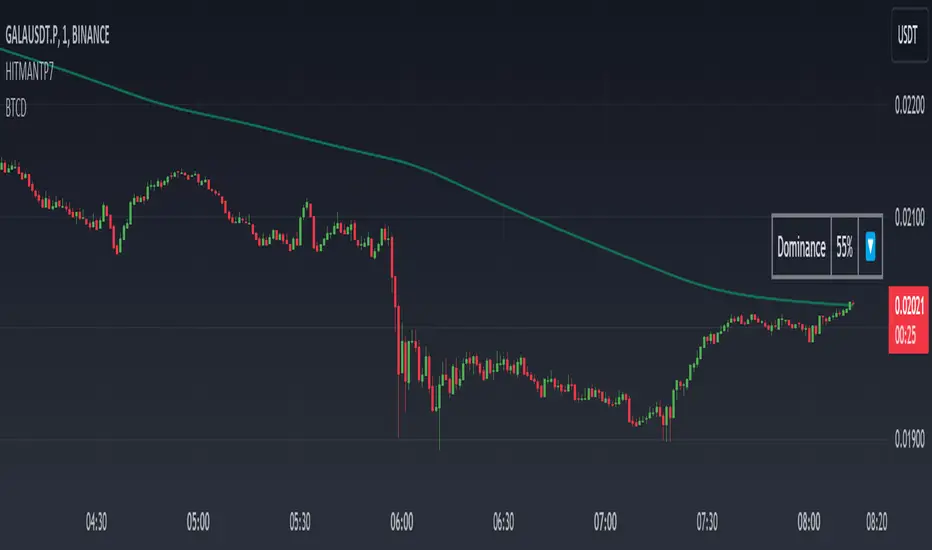
The "Dominance Dashboard" is a TradingView indicator designed to provide traders with a clear and concise visual representation of Bitcoin Dominance (BTC.D). This script helps traders monitor BTC.D in real-time, offering insights into market dynamics and potential trading signals based on the changes in Bitcoin's market dominance.
Key Features
Real-Time BTC Dominance: Displays the current Bitcoin Dominance percentage.
Historical Comparison: Shows the previous day's Bitcoin Dominance for comparison.
Visual Indicators: Utilizes color-coded arrows to indicate changes in Bitcoin Dominance (increase or decrease).
Customizable Table Settings: Users can customize the position, size, and colors of the displayed table to suit their preferences.
How It Works
Data Retrieval: The script uses request.security to fetch the latest and previous day's BTC.D data.
Comparison Mechanism: It compares the current BTC Dominance with the previous day's value to determine whether BTC.D has increased, decreased, or remained unchanged.
Dynamic Table Display: Based on user preferences, the script dynamically adjusts the table's position, text size, and colors.
Using the Indicator
Table Settings:
Show Header: Toggle the visibility of the table header.
Position: Choose from various predefined positions (e.g., Top Right, Bottom Right) to place the dashboard on your chart.
Text Size: Select the text size (Tiny, Small, Normal, Large) for better readability.
Text and Border Colors: Customize the text and border colors to match your chart's theme.
Timeframe Settings:
Show Current BTC Dominance: Enable or disable the display of the current BTC Dominance percentage.
Underlying Concepts
BTC Dominance: Bitcoin Dominance (BTC.D) measures Bitcoin's market capitalization relative to the total market capitalization of all cryptocurrencies. Monitoring BTC.D helps traders understand the flow of capital in and out of Bitcoin compared to other cryptocurrencies.
Visual Change Indicators: The script uses simple arrow symbols (🔼 for an increase and 🔽 for a decrease) to provide quick visual cues about the direction of change in BTC Dominance. This feature helps traders quickly assess market conditions without deep analysis.
Practical Use Cases
Market Sentiment Analysis: A rising BTC Dominance could indicate a market shift towards Bitcoin, potentially signaling a bearish sentiment for altcoins. Conversely, a falling BTC Dominance might suggest increased interest in altcoins.
Trend Confirmation: Traders can use BTC Dominance trends to confirm their trading strategies. For example, if a trader is bullish on Bitcoin, an increasing BTC Dominance might reinforce their position.
Portfolio Management: By monitoring BTC Dominance, traders can make informed decisions about portfolio rebalancing between Bitcoin and other cryptocurrencies.
Script de código abierto
Fiel al espíritu de TradingView, el creador de este script lo ha convertido en código abierto, para que los traders puedan revisar y verificar su funcionalidad. ¡Enhorabuena al autor! Aunque puede utilizarlo de forma gratuita, recuerde que la republicación del código está sujeta a nuestras Normas internas.
Exención de responsabilidad
La información y las publicaciones no constituyen, ni deben considerarse como asesoramiento o recomendaciones financieras, de inversión, de trading o de otro tipo proporcionadas o respaldadas por TradingView. Más información en Condiciones de uso.