OPEN-SOURCE SCRIPT
Actualizado EMA Cross [26,12]
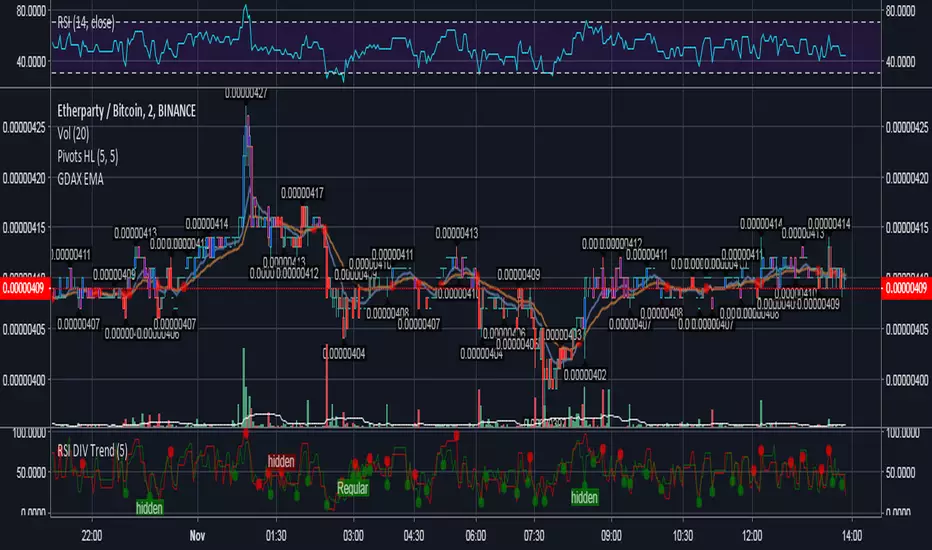
GDax EMA[26,12] with crossing highlight
Notas de prensa
This indicator allow to show the EMA of the price similar to GDAX user interface.The purpose of this indicator is twice:
- Allowing the user to show a double EMA with the possibility to show when a EMA crossing happens.
- Showing in a more user friendly interface the GDAX ema line.
As a matter of fact is proven that those 2 EMA act as support/resistance during Bulls/Bear periods. The indicator works fine in the GDax timeframes, or rather 5m, 15m, 1h and daily excluding 3h and 6h as they're less used at the moment.
Notas de prensa
This is the deprecated scriptScript de código abierto
Fiel al espíritu de TradingView, el creador de este script lo ha convertido en código abierto, para que los traders puedan revisar y verificar su funcionalidad. ¡Enhorabuena al autor! Aunque puede utilizarlo de forma gratuita, recuerde que la republicación del código está sujeta a nuestras Normas internas.
Exención de responsabilidad
La información y las publicaciones no constituyen, ni deben considerarse como asesoramiento o recomendaciones financieras, de inversión, de trading o de otro tipo proporcionadas o respaldadas por TradingView. Más información en Condiciones de uso.
Script de código abierto
Fiel al espíritu de TradingView, el creador de este script lo ha convertido en código abierto, para que los traders puedan revisar y verificar su funcionalidad. ¡Enhorabuena al autor! Aunque puede utilizarlo de forma gratuita, recuerde que la republicación del código está sujeta a nuestras Normas internas.
Exención de responsabilidad
La información y las publicaciones no constituyen, ni deben considerarse como asesoramiento o recomendaciones financieras, de inversión, de trading o de otro tipo proporcionadas o respaldadas por TradingView. Más información en Condiciones de uso.