OPEN-SOURCE SCRIPT
PowerXYZ Strategy (PowerX Modified)
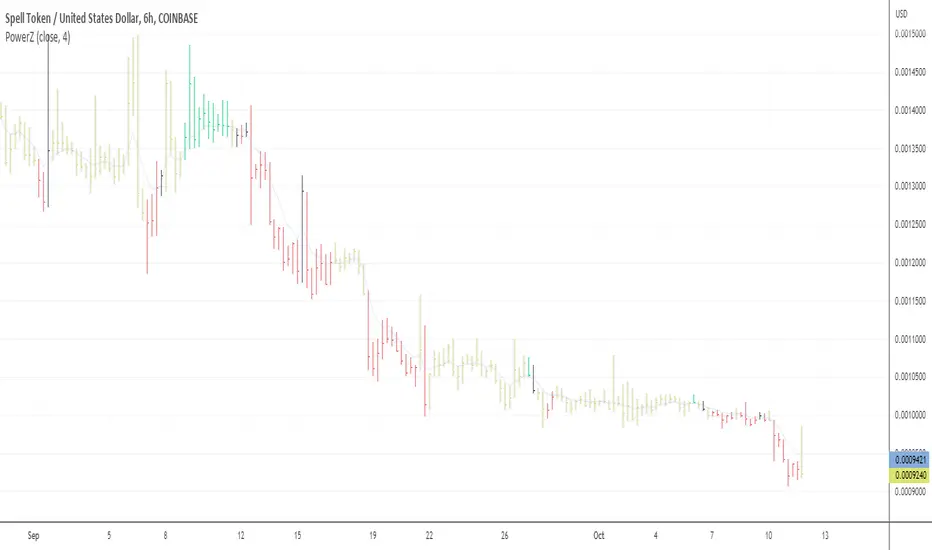
This script modifies the PowerX strategy in the following ways:
- there are two types of 'black' bars, yellow and black; the bars that are colored black indicate the flip of the RSI from positive to negative, and vise versa, while the signal is also near to green or red color; the close of these bars are a strong indication of support or resistance, and the previous closes behind these bars create S&D zones.
- compares the typical price to the 4-period smoothed moving average to generate yellow bars sooner at the end of trends.
- uses a signal line of > 49 and <= 49 instead of 50.
Yellow indicates that you should probably move your stop closer to the current price.
Black indicates that you should probably exit and look for a new entry, as it is a strong area of support or resistance.
Script de código abierto
Fiel al espíritu de TradingView, el creador de este script lo ha convertido en código abierto, para que los traders puedan revisar y verificar su funcionalidad. ¡Enhorabuena al autor! Aunque puede utilizarlo de forma gratuita, recuerde que la republicación del código está sujeta a nuestras Normas internas.
Exención de responsabilidad
La información y las publicaciones no constituyen, ni deben considerarse como asesoramiento o recomendaciones financieras, de inversión, de trading o de otro tipo proporcionadas o respaldadas por TradingView. Más información en Condiciones de uso.