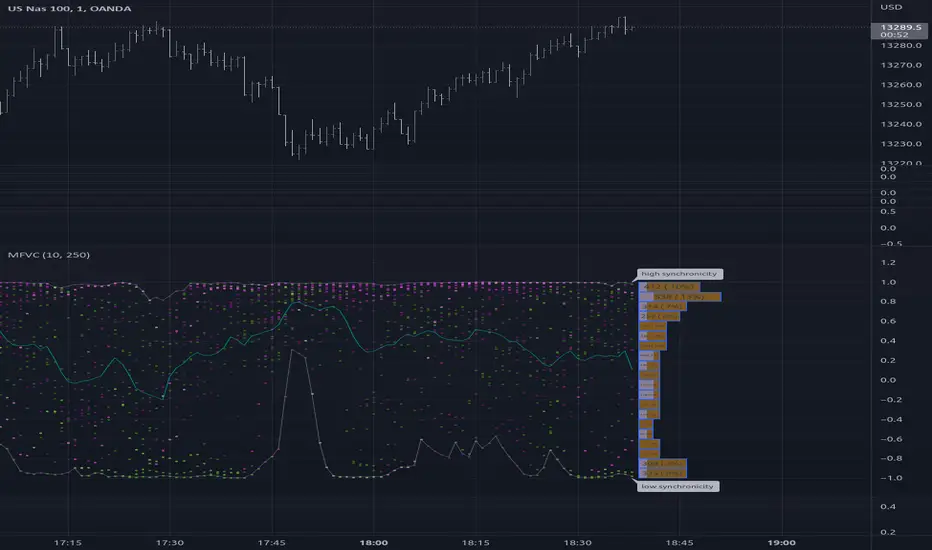
This is a complex indicator that looks to provide some insight into the correlation between volume and price volatility.
Rising volatility is depicted with the color green while falling volatility is depicted with purple.
Lightness of the color is used to depict the length of the window used, darker == shorter in the 2 -> 512 window range.
Rising volatility is depicted with the color green while falling volatility is depicted with purple.
Lightness of the color is used to depict the length of the window used, darker == shorter in the 2 -> 512 window range.
Notas de prensa
added a histogram to show last and recent(10 bars) distribution of correlationNotas de prensa
updated histogram calculation, it now allows the input length of the aggregation of values, added values display on histogram bars.Notas de prensa
added labels with some description.Script de código abierto
Fiel al espíritu de TradingView, el creador de este script lo ha convertido en código abierto, para que los traders puedan revisar y verificar su funcionalidad. ¡Enhorabuena al autor! Aunque puede utilizarlo de forma gratuita, recuerde que la republicación del código está sujeta a nuestras Normas internas.
Exención de responsabilidad
La información y las publicaciones no constituyen, ni deben considerarse como asesoramiento o recomendaciones financieras, de inversión, de trading o de otro tipo proporcionadas o respaldadas por TradingView. Más información en Condiciones de uso.
Script de código abierto
Fiel al espíritu de TradingView, el creador de este script lo ha convertido en código abierto, para que los traders puedan revisar y verificar su funcionalidad. ¡Enhorabuena al autor! Aunque puede utilizarlo de forma gratuita, recuerde que la republicación del código está sujeta a nuestras Normas internas.
Exención de responsabilidad
La información y las publicaciones no constituyen, ni deben considerarse como asesoramiento o recomendaciones financieras, de inversión, de trading o de otro tipo proporcionadas o respaldadas por TradingView. Más información en Condiciones de uso.