OPEN-SOURCE SCRIPT
Actualizado ScalpTrader RSI

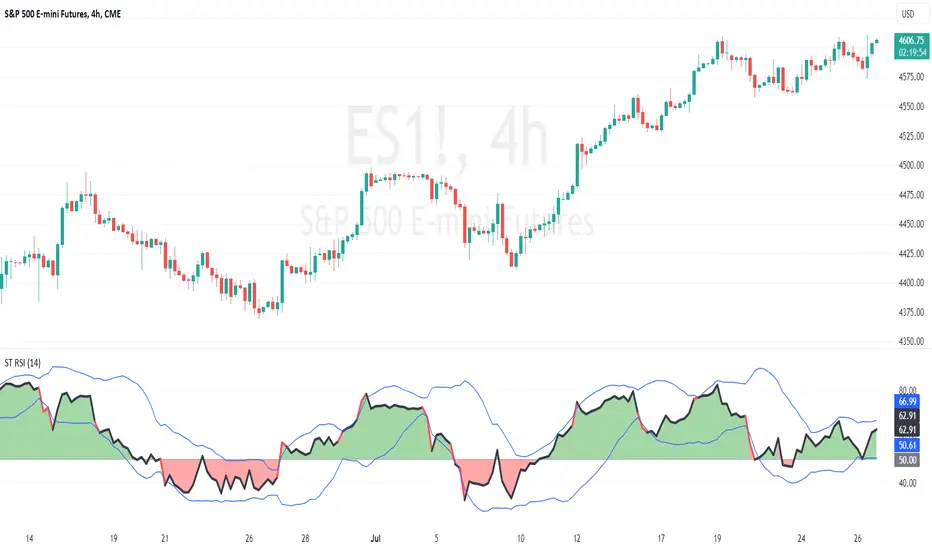
This script is a customized Relative Strength Index (RSI) indicator with added functionality, notably the optional Bollinger Bands overlay.
At its core, the script calculates the RSI, which is a popular momentum indicator used in technical analysis to identify overbought and oversold conditions. It does this by taking the average gain and the average loss over a user-defined period (default is 14) to compute the relative strength, which is then transformed into the RSI.
Furthermore, this script provides the option to overlay Bollinger Bands on the RSI line. Bollinger Bands, consisting of a middle band (a moving average) with two outer bands (standard deviations of the middle band), are used to measure volatility and 'relative' high or low prices. When applied to the RSI, they can offer another perspective on the momentum and volatility of the market.
RSI plot values are colored green if above 50 and red if below 50 to give the trader a sense of bullish or bearish price action.
I hope you find the indicator useful. Enjoy.
Notas de prensa
Fix overlay settingNotas de prensa
Update commentNotas de prensa
Add highlight to RSI when above/below bandsNotas de prensa
Name updateNotas de prensa
Update licenseScript de código abierto
Fiel al espíritu de TradingView, el creador de este script lo ha convertido en código abierto, para que los traders puedan revisar y verificar su funcionalidad. ¡Enhorabuena al autor! Aunque puede utilizarlo de forma gratuita, recuerde que la republicación del código está sujeta a nuestras Normas internas.
Exención de responsabilidad
La información y las publicaciones no constituyen, ni deben considerarse como asesoramiento o recomendaciones financieras, de inversión, de trading o de otro tipo proporcionadas o respaldadas por TradingView. Más información en Condiciones de uso.
Script de código abierto
Fiel al espíritu de TradingView, el creador de este script lo ha convertido en código abierto, para que los traders puedan revisar y verificar su funcionalidad. ¡Enhorabuena al autor! Aunque puede utilizarlo de forma gratuita, recuerde que la republicación del código está sujeta a nuestras Normas internas.
Exención de responsabilidad
La información y las publicaciones no constituyen, ni deben considerarse como asesoramiento o recomendaciones financieras, de inversión, de trading o de otro tipo proporcionadas o respaldadas por TradingView. Más información en Condiciones de uso.