PROTECTED SOURCE SCRIPT
B&W HEATMAP
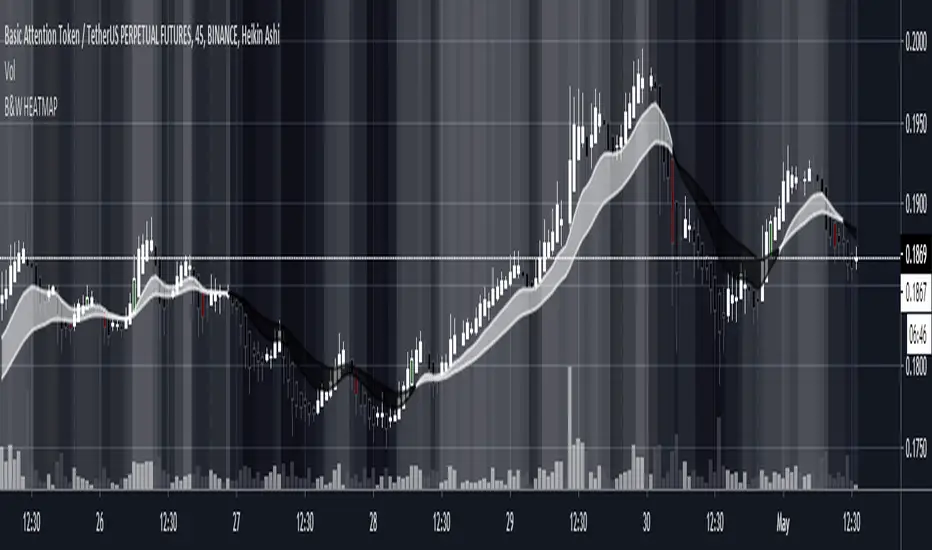
A Black and white heatmap (you can change to any colors in settings) overlay for better trend analysis. Use the crossovers to determine directional bias. Can be used with any other MA cross, baseline, or trendline strategies to help decide if a trade is worth taking. The gradient from black to white represent the strength of the trend . Black = Downtrend, White = Uptrend, Gray=range/chop. Candle colors indicate potential Long/Short
Script protegido
Este script se publica como código cerrado. Sin embargo, puede utilizarlo libremente y sin limitaciones: obtenga más información aquí.
Exención de responsabilidad
La información y las publicaciones que ofrecemos, no implican ni constituyen un asesoramiento financiero, ni de inversión, trading o cualquier otro tipo de consejo o recomendación emitida o respaldada por TradingView. Puede obtener información adicional en las Condiciones de uso.